
Figures & data
Figure 1. Experimental design.
APP/PS1 transgenic mice aged 9 months were used as the disease group and wild-type mice aged 9 months born in the same litter were used as the control group. The cognitive level in each group was determined using the Morris water maze test. 18F-AV45 and 18F-DPA714 PET-CT were used to detect the levels of Aβ plaques and neuroinflammation in the brains of mice. Fecal and serum samples from each group were collected for 16S rRNA sequencing and untargeted metabolomic detection, respectively. Brain samples from each group were used for spatial metabolomics, immunofluorescence, and transcriptomic analyses. Multi-omics data were integrated for correlation analysis to explore the interaction between the gut microbiota and the brain in APP/PS1 mice. Finally, the results of the multi-omics was verified through gut microbiota transplantation (FMT) intervention.
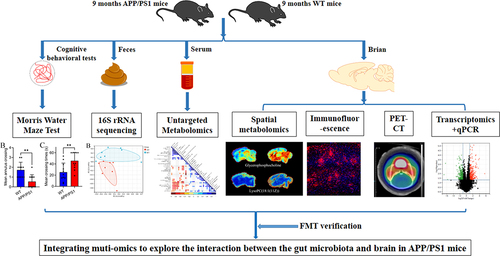
Figure 2. Cognitive level and neuropathology in APP/PS1 and WT mice.
(a) The escape latency from the day1 to day 5. (b) The times of platform crossing within 1 minute at the day 6. (c) The escape latency within 1 minute at the day 6. (d) Total swimming distance within 1 minute. (e) Mean swimming speed within 1 minute. n = 11 per group. (f-g) The 18F-AV45 PET-CT images of brain and quantification of the mean SUV numbers. n = 3 per group. (h-k) Immunofluorescence and quantification of 4G8 (Scale bars = 200 μm) and NeuN (Scale bars = 100 μm) in cortex. Data were presented as mean ± SD. Statistics were analyzed using two-tailed Student’s t test. *P <.05, **P <.01, ***P <.001, ****P <.0001, ns: no statistical difference.
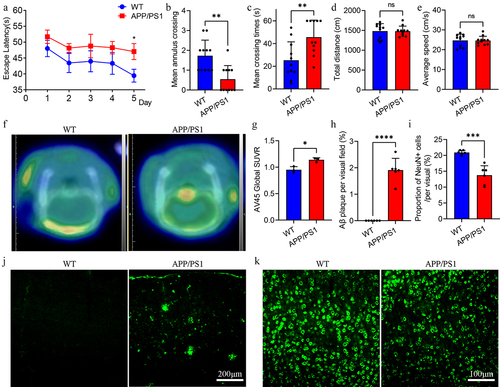
Figure 3. The difference of gut microbiota between APP/PS1 and WT mice.
(a) α diversity (Simpson diversity) of gut microbiota. (b) Principal co-ordinates analysis (PCoA) at genus level (PERMANOVA test). (c) The composition of gut microbiota at the genus level. (d-h) Five bacterial genera had significant difference at the genus level between APP/PS1 and WT mice. n = 8 per group. Data were presented as mean ± SD. Statistics were analyzed using Wilcoxon Mann Whitney test. *P <.05, ***P <.001, ns: no statistical difference.
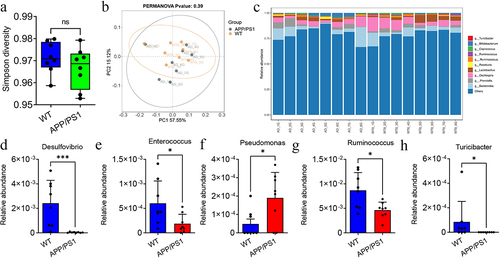
Figure 4. The difference of metabolites in serum and brain of APP/PS1 and WT mice.
(a) Principal Component Analysis (PCA) of metabolites in serum of APP/PS1 and WT mice. n = 8 per group. (b) Volcanic map shows different metabolites in serum between APP/PS1 and WT mice. (c) Kyoto Encyclopedia of Genes and Genomes (KEGG) enrichment analysis of different metabolites in serum between APP/PS1 and WT mice. (d) Principal Component Analysis (PCA) of metabolites in brain of APP/PS1 and WT mice. n = 3 per group. (e) Volcanic map shows different metabolites in brain between APP/PS1 and WT mice. (f) KEGG enrichment analysis of different metabolites in brain between APP/PS1 and WT mice. (g) Venn diagram shows the common metabolic pathways between the serum and brain in APP/PS1 and WT mice. (h-j) Different metabolites of glycerophospholipid metabolism in serum between APP/PS1 and WT mice. (k-o) Different metabolites of glycerophospholipid metabolism in brain between APP/PS1 and WT mice. Data were presented as mean ± SD. Statistics were analyzed using two-tailed Student’s t test. *P <.05, **P <.01, ns: no statistical difference.
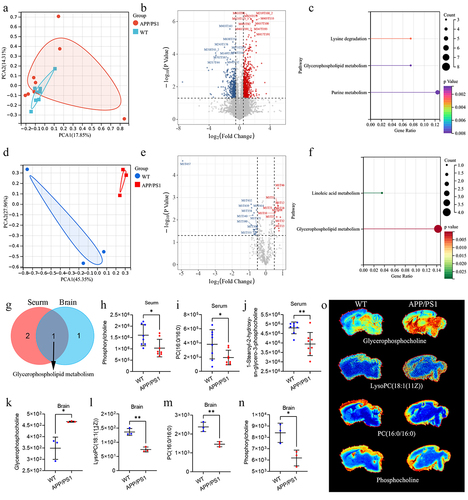
Figure 5. Difference analysis of neuroinflammation and signaling pathway in APP/PS1 and WT mice.
(a-b) The 18F-DPA714 PET-CT images of brain and quantification of the mean SUV numbers. n = 3 per group. (c-f) Immunofluorescence and quantification of GFAP and TMEM119 in cortex of each group. Scale bars = 200 μm. n = 6 per group. (g) PCA of gene expression level in brain between APP/PS1 and WT mice. n = 3 per group. (h) Volcanic map shows differently expressed genes in brain between APP/PS1 and WT mice. The |log2FC| > 1 and p < 0.05 were considered statistically significant. (i) WikiPathway enrichment analysis of differently expressed genes. (j) Hub differently expressed genes between APP/PS1 and WT mice. (k-y) Quantitative real-time PCR analysis of hub differently expressed genes between APP/PS1 and WT mice. Data were presented as mean ± SD. Statistics were analyzed using two-tailed Student’s t test. *P <.05, **P <.01, ***P <.001, ****P <.0001, ns: no statistical difference.
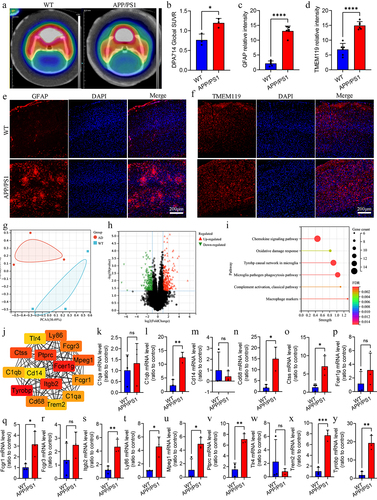
Figure 6. Correlation analysis of different gut microbiota, metabolites and hub differently expressed genes.
(a) Spearman correlation analysis of different gut microbiota and metabolites in serum. (b) Spearman correlation analysis of different metabolites and hub differently expressed genes in brain. (c) Correlation network of different gut microbiota, metabolites, and hub differently expressed genes. The blue line showed a negative correlation and the red line indicates a positive correlation. P value was corrected by Benjamini-Hochberg method. *P <.05, **P <.01, ***P <.001.
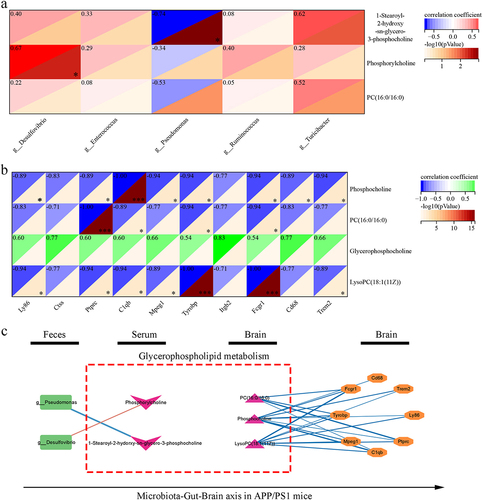
Figure 7. FMT intervention regulated glycerophospholipid metabolism and ameliorated Aβ pathology and neuroinflammation in APP/PS1 mice.
(a) The process of FMT intervention. (b-d) Glycerophospholipid metabolism related metabolite difference between APP/PS1 control and FMT group. (e-j) Immunofluorescence and quantification of 4G8 (Scale bars = 200 μm), GFAP (Scale bars = 200 μm), and TMEM119 (Scale bars = 200 μm) in cortex. (k-t) Quantitative real-time PCR analysis of hub differently expressed genes between APP/PS1 control and FMT group. Data were presented as mean ± SD. Statistics were analyzed using two-tailed Student’s t test. *P <.05, **P < .01, ***P <.001, ns: no statistical difference.
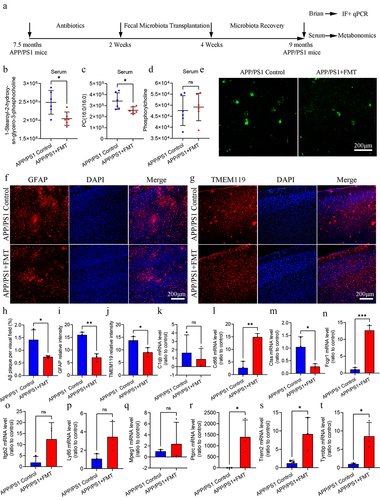
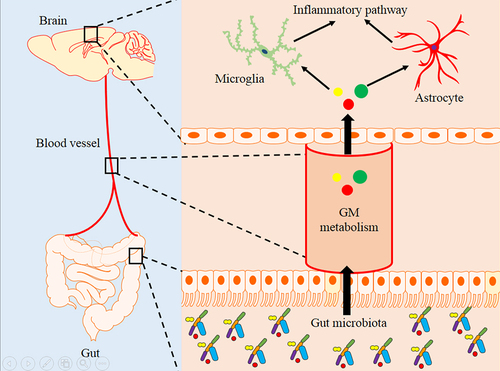
Figure 8. The diagram of the hypothesis model in this study.
Supplemental material