
Figures & data
Figure 1. (a) Schematic of experimental protocol. (b) Anastomotic scoring examples demonstrating healed anastomosis with local adhesions (top left), contained AL/perianastomotic abscess (bottom left), and anastomotic dehiscence with gross peritonitis (right). Arrows point to anastomosis.
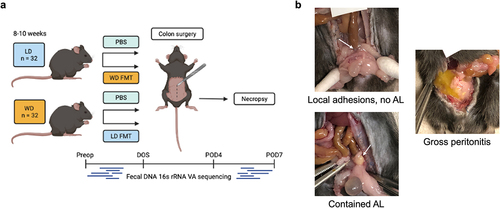
Table 1. Survival contingency table: no significant differences in survival to necropsy on POD7 between groups.
Table 2. AL contingency table: no significant difference in AL observed between control dietary groups or between LD mice that received PBS vs. FMT. Significant reduction in AL observed in WD mice that received FMT vs. PBS.
Figure 2. a) Mean weight on DOS varied by dietary group: LD: 30.6 ± 2.6 g, WD: 36.4 ± 4.0 g (ANOVA F = 47.2, P <.0001). b) abundant taxa for each dietary groups after 10-week feeding period prior to DietGel initiation (baseline). c) Bray-Curtis dissimilarity indices demonstrated significant clustering by diet at baseline (ANOSIM R = 0.15, P <.001). Genera significantly correlated to dietary axis position by Spearman correlation are plotted on the PCoA chart with vector length indicating magnitude of correlation. *Not further classified to genus.
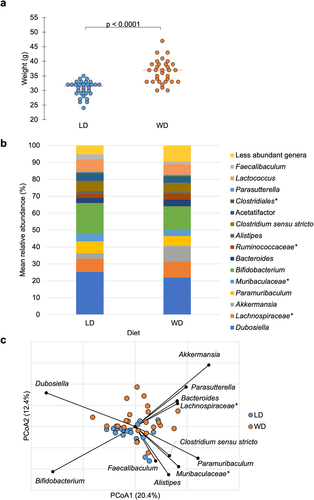
Table 3. Alpha diversity. ANOVA performed for pairwise comparisons demonstrated that LD had significantly higher alpha diversity at baseline (by Chao1 index) and on POD4 (by Shannon and Chao1 index). On POD4, WD mice with AL had significantly lower alpha diversity compared to mice without AL in both PBS and FMT groups.
Figure 3. (a) Significant clustering was observed on POD4 in the LD mice based on presence or absence of AL (ANOSIM R = 0.49, P <.001) with genera significantly correlated to axis position by Spearman correlation shown. (b) clustering between AL and no AL approached significance in the WD group (ANOSIM R = 0.27, P =.05). (c) clustering based on AL was lost with in LD mice that received FMT (FMT_N vs. FMT_Y, ANOSIM R = 0.085, P = 0.26). (d) significant clustering between AL and no AL was demonstrated among WD mice (ANOSIM R = 0.15, P =.047). FMT treatment made mice without AL further from mice with AL than PBS (FMT_N vs. PBS_Y, ANOSIM R = 0.28, P = 0.017; PBS_N vs. PBS_Y, ANOSIM R = 0.27, P =.043, Bonferroni pair-wise error rate 0.017). Genera significantly correlated to axis position by Spearman correlation are shown. *Not further classified to genus.
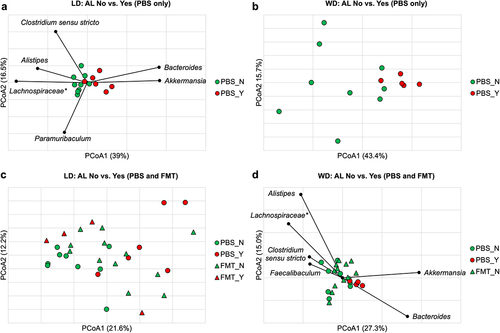
Figure 4. Canonical correspondence analysis demonstrates directional relationships between macronutrients, AL, and genera on POD4. *Not further classified to genus.
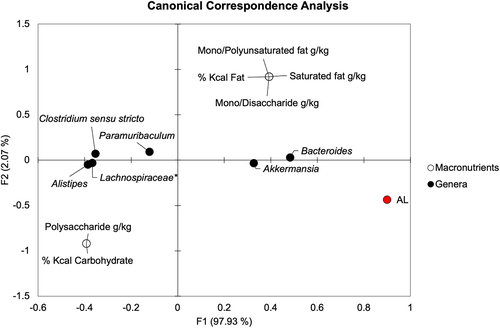
Figure 5. (a) Principal coordinate analysis (r2 = 0.67) of Bray-Curtis dissimilarities among all samples on POD4. Groups are differentiated by color. Ellipses indicate approximate separation of samples by ANOSIM. (b) genera significantly correlated to axis position by Spearman correlation. *Not further classified to genus.
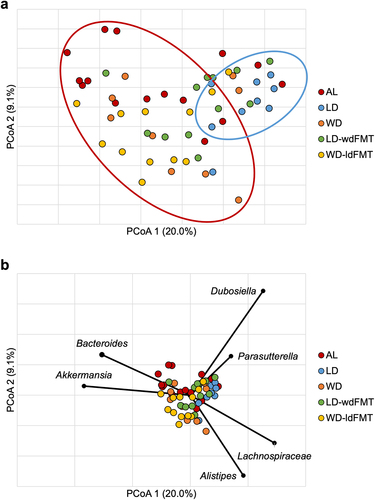
Table 4. Median relative abundances of predominant genera with interquartile range in brackets. Bolded taxa indicate a significant difference way found in a Kruskal–Wallis pairwise comparison. Superscripts indicate which specific Kruskal–Wallis pairwise comparison was significant.
Table 5. Median AL index scores among all groups with interquartile range in brackets.
Supplemental Material
Download MS Word (14.4 MB)Data availability statement
Sequence data were deposited in the NCBI SRA under accession number SRP408098 and can be found at https://www.ncbi.nlm.nih.gov/sra/?term=SRP408098.