
Figures & data
Figure 1. Flow chart of patients included and excluded in this trial.
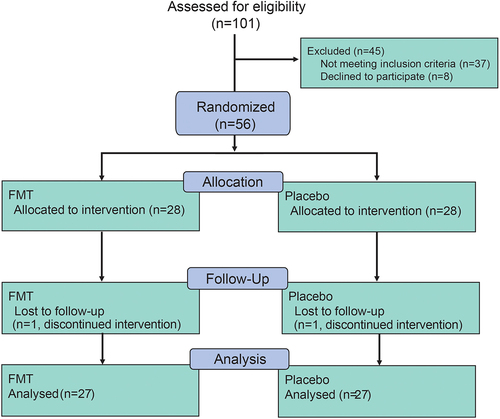
Table 1. · baseline characteristics of participants.
Table 2. Adverse effects occurred in participants.
Table 3. Clinic outcomes of participants of FMT and placebo arms.
Figure 2. The baseline characteristics of gut microbiota in donors and patients with PD (placebo/FMT group). a-b: α diversity of gut microbiota in different groups according to estimate of Faith_Pd (a) and estimate of Observed_Otus (b) (ns, not significant, ***p <.001; Wilcoxon sum-rank test.); c: Principal coordinate analysis (PCoA) of the microbiota between three groups by R package vegan. (ANOSIM; donor vs. F.0W, R = 0.2055, p = .125; donor vs. P.0W, R = 0.1797, p = .15; F.0W vs. P.0W, R = 0.0041, p = .338); D: bar plots showing the relative abundance of gut microbiota of three groups of individuals at the phylum level, with different colors corresponding to different phyla; E: heat map showing the relative abundance of three groups of individuals at the genus level (samples from the same donor was marked as D1, D2, D3, and D4). Only significantly different genera were shown between donors and patients with PD (R package ALDEx2, we.Ep <.05 and wi.Ep <.05).
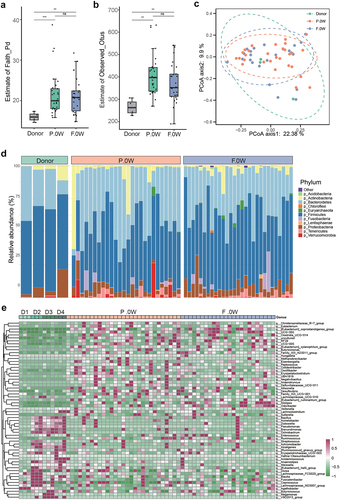
Figure 3. Comparison of gut microbiota between responders and non-responders after FMT treatment. A: patients who underwent FMT treatment had different responses during follow-up according to the MDS-UPDRS score, and the FMT cohort was subdivided into FMT responders (FMT.R, red lines) and FMT non-responders (FMT.NR, cyan lines) based on MDS-UPDRS 2, FMT.R showed a remarkable decrease in MDS-UPDRS total, part 2, part 3, and part 4 score (*: P < .05, **: P < .01, ***: P < .001, ***: P < .0001, generalized estimating equation); B: schematic illustration of subgroup analysis in the FMT arm; C: α-diversity of gut microbiota in FMT.NR and FMT.R subgroups according to estimate of richness; D: Principal coordinates analysis (PCoA) of the microbiota based on the unweighted unifrac distance between FMT.R and FMT.NR subgroups at the end of this trial by R package Vegan; E: metagenomic sequencing analysis showed there are 20 microbial species with significantly different abundance by comparing FMT.NR with FMT.R subgroup; F: the correlation analysis of gut microbiota taxa and clinic outcome of gastrointestinal disorders, PD symptoms, cognition, and depression (*p <.05, **P <.01, Spearman correlation analysis); G: different functional pathways between FMT.NR and FMT.R subgroup; H: the correlation analysis of gut microbiota functional pathways and clinic outcomes. (*p <.05, **P <.01, Spearman correlation analysis).
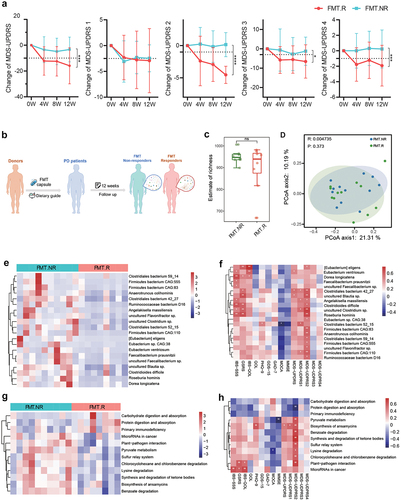
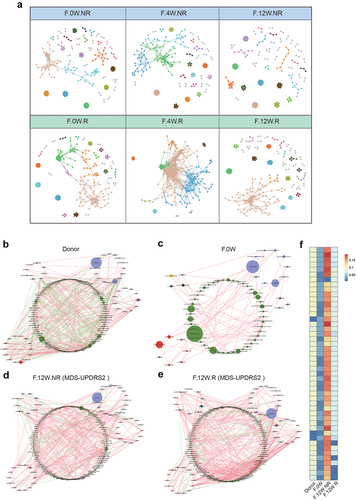
Figure 4. The microbial network analysis in participants after FMT. a: visualization of constructed MENs in FMT.R and FMT.NR subgroups at different times. 18 large modules are shown in different colors, and smaller modules are shown in gray. b-e: comparison of the genera co-occurrence networks between different subgroups. Network plots describing the co-occurrence of bacterial genera in the gut microbiota of donor (b), F.0W (c), F.12W.NR (d), F.12W.R (e) based on the Spearman correlation algorithms (r ≥ 0.7, p < .05), bacterial genera with at least 0.01% of relative abundance in at least 20% of the samples in each group were plotted. Each node presents a bacterial genus. The node size indicates the relative abundance of each genus per group, and the density of the dashed line represents the Spearman coefficient. Red links stand for positive interactions between nodes, and green links stand for negative interactions; f: discrepancies of the genera co-occurrence networks among groups based on the 16S rRNA data. The centralities (rank of the closeness) and discrepancies of nodes in four subgroups’ co-occurrence networks were counted, respectively.
Supplemental Material
Download Zip (1.6 MB)Data availability statement
All sequencing data generated in the preparation of this manuscript have been deposited in the China National GeneBank DataBase (CNGBdb, https://db.cngb.org/) with accession number CNP0002130 for 16S sequencing, and CNP0004940 for metagenomic sequencing.
Anonymized data will be made available upon reasonable request to the chief investigator. Proposals will be reviewed and approved by the sponsor, chief investigator, and collaborators based on scientific merit. After approval of a proposal or request, data can be shared through a secure online platform after signing a data access agreement.