
Figures & data
Figure 1. Application of a mouse model of IBD to test the effect of gut inflammation on the evolution of NC101.
a Schematic of the experimental setup. Germ-free WT and Il10−/− mice were monocolonized with E. coli NC101. Fecal samples were collected from each mouse at the indicated time points and analyzed as described. b Fecal lipocalin-2 levels from the WT and Il10-/- mice. Lipocalin-2 was measured using the Mouse Lipocalin-2/NGAL DuoSet ELISA and normalized to feces weight. Each dot represents one mouse at each sampling point. Results of Wilcoxon signed-rank test of lipocalin-2 concentrations at each time point are reported in Table S3. Differences were considered statistically significant at Benjamini-Hochberg-corrected P < .05. c Boxplots of the histopathology scores of the colon tissue of mice after sacrifice at the end of the experiment. Each dot represents a single mouse. Differences were considered statistically significant using the Kruskal-Wallis H test at Benjamini-Hochberg-corrected P < .05. d Number of de-novo mutations in the bacterial populations at week 12 in WT and KO mice compared with the reference genome. Each dot represents a bacterial population from a single mouse. Differences were considered statistically significant using the Kruskal-Wallis H test at Benjamini-Hochberg-corrected P < .05. e Partial least squares-discriminant analysis of the de-novo mutated genes in the evolved populations of E. coli NC101 at week 12 in WT and KO mice compared to the reference genome. Differences were considered statistically significant at a PERMANOVA P < .05.
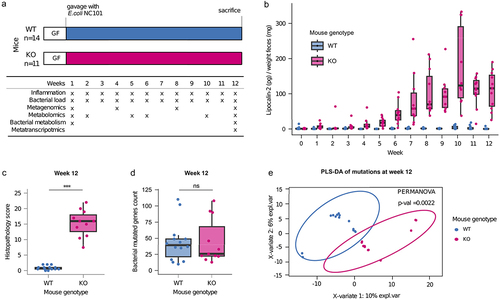
Figure 2. Parallel evolution of E. coli in inflamed mice revealed a disease-specific genetic signature.
a Parallelly mutated genes were classified based on KEGG pathways; b An intergenic C>T mutation 9-nt upstream of mprA was the unique parallel mutation significantly more abundant in populations evolved in the inflamed gut (Wilcoxon signed-rank test Benjamini-Hochberg corrected P < .005). The heatmap shows the frequency of the mutation in bacterial populations from each mouse. c Mutation frequency (left axis) of the intergenic C>T mutation 9-nt upstream of mprA and mean of lipocalin-2 concentrations across KO mice at different timepoints during the in vivo evolution experiment. Each line represents a population from a single mouse. Each bar represents the mean value of the normalized concentration of lipocalin-2 in fecal samples from KO mice.
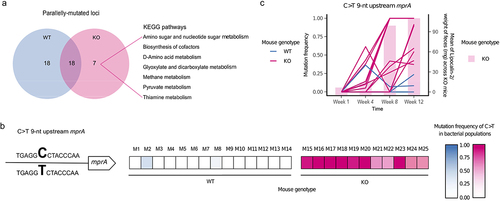
Figure 3. Phenotypic characterization of evolved E. coli and the inflammatory environment in which they were selected.
a Evolved populations from a subset of mice (N = 5 KO mice and N = 5 WT mice) were cultured in media derived from the cecal content collected from healthy (WT) and inflamed (KO) mice after sacrifice. The area under the curve (AUC) calculated from growth curves measured during the growth of evolved populations from each mouse in inflamed and healthy cecal contents is shown. Each dot represents the mean of three independent replicates. *P < .05 (Kruskal-Wallis H test); ns, not significant. b Partial least squares discriminant analysis (PLS-DA) of the fecal metabolite abundances at different time points during the evolution experiment. Differences were considered statistically significant at PERMANOVA P < .05. c Bacterial metabolism was measured in vitro in a range of compounds. Measurements were performed on bacterial populations derived from fecal samples collected at weeks 1 and 12 of the in vivo evolution experiments. Partial least squares discriminant analysis (PLS-DA) was performed on the area under the curves (AUCs) of the measured metabolic activity of the evolved bacterial populations from all mice in the range of compounds. Differences were considered statistically significant at PERMANOVA P < .05. d Compounds from the fecal metabolome and the in vitro screen with the shortest path were inspected. One of the pairs with the shortest path was glutamate-arginine. Glutamate was enriched in the fecal metabolome of KO mice, whereas KO-adapted bacteria showed higher metabolic activity in the presence of arginine. Each dot represents the mean metabolic activity of the bacterial population from a mouse in the presence of L-arginine from two independent measurements (left) or the abundance of glutamate in the fecal sample from a mouse (right). *P < .05 (Kruskal-Wallis test at Benjamini-Hochberg-corrected), ns, not significant.
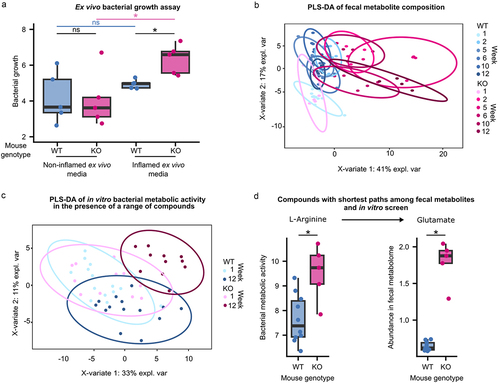
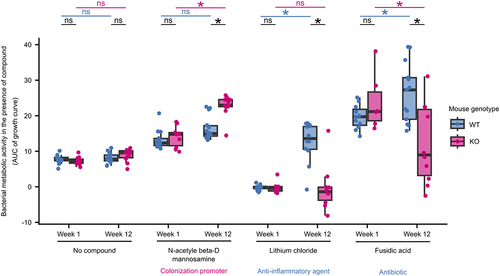
Figure 4. E. coli adapted to the inflamed gut show phenotypes with clinical relevance.
Metabolic activity of bacteria isolated at weeks 1 and 12 of the evolution experiment in the presence of three selected compounds. Area under the curve (AUC) was calculated from growth curves measured during the growth of evolved populations in the presence of each compound. Each dot represents the mean of the metabolic activities of the E. coli population from a mouse measured in two independent experiments. *, P < .05 (Kruskal-Wallis test at Benjamini-Hochberg-corrected). The clinical relevance of the three compounds is indicated.
Supplemental material
Supplementary_tables_GutMicrobes_rev1.xlsx
Download MS Excel (2.6 MB)Supplementary_figures_GutMicrobes_rev1 clean.docx
Download MS Word (2.5 MB)Data availability statement
Escherichia coli NC101 reference genome is available under Bioproject number PRJNA596436. Shotgun metagenomic sequencing of the inocula and evolved populations and metatranscriptomic of the populations at week 12 are available with Bioproject number PRJNA1012288.