
Figures & data
Figure 1. Mycobiota characteristic of healthy subjects. (a). Violin plot of the fungal load observed in the 695 healthy subject fecal samples. (b). Alpha diversity : violin plot of the Shannon Index obtained for 604 healthy subjects’ fecal samples. (c). Beta diversity: Bray-Curtis dissimilarity values between samples donated by different subjects for ITS2 sequencing data obtained for 604 healthy subjects. Values range from 0 to 1, with 0 being the least dissimilar and 1 being the most dissimilar. (d). Barplot of the mean relative abundances of the fungal species that were detected in at least 50% of the 604 studied healthy subjects with a relative abundance above 0.1%. (e). Barplot of the mean relative abundances of the fungal genera that were detected in at least 50% of the 604 studied healthy subjects with a relative abundance above 0.1%. (f) Violin plot of C. albicans DNA levels observed in the 695 healthy subject fecal samples.
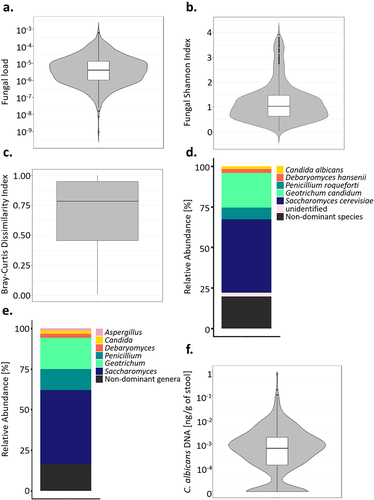
Figure 2. Effect of the age and sex of the subjects on C. albicans carriage. (a). Boxplot of the distribution of C. albicans DNA levels in male and female subjects. (b). Boxplot of the distribution of C. albicans DNA levels depending on the age of the subjects in the subjects colonized by C. albicans. (c) Percentage of subjects colonized by C. albicans (green) and not colonized (white) within each age group. The percentage of colonized and not colonized subjects within each age group are noted in italics *p-value < .05.
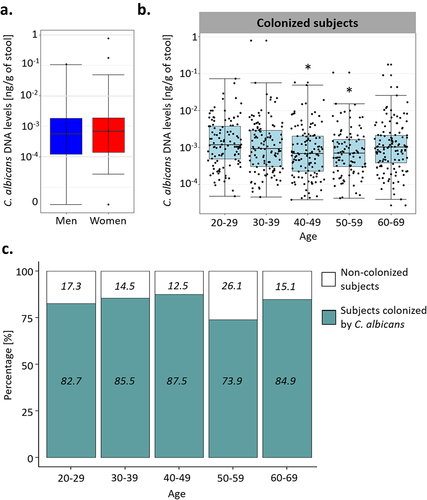
Figure 3. Characterization of bacterial species supernatants and their effect on C. albicans growth. (a). Characterization of the short-chain fatty acids (SCFA) content of each of the bacterial species tested. The SCFA were quantified in the culture supernatants and normalized against the background growth medium control. (b). Boxplot representing the effect of bacterial culture supernatants on the survival of C. albicans, strain SC5314 after 24 h of exposure, relative to the control growth in M2GSC medium (red line, confidence intervals are represented in orange). NGY: C. albicans growth in NGY medium, PBS: C. albicans growth in PBS.
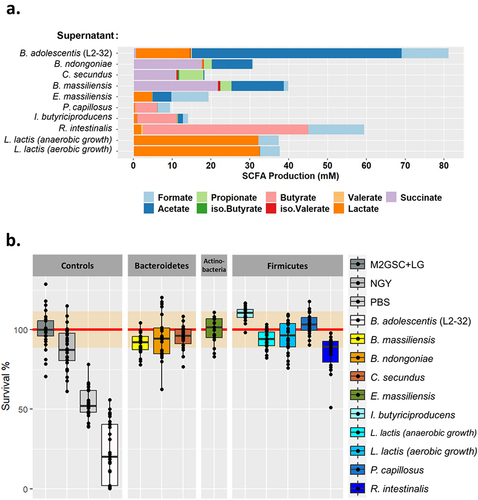
Figure 4. Comparison of the gut mycobiota of the Milieu intérieur subjects colonized by C. albicans with that of non-colonized Milieu Intérieur subjects. (a). Boxplot of the distribution of fungal Shannon index depending on C. albicans colonization state. (b). Barplot of the mean relative abundances of the fungal species that were detected in at least 50% of the studied healthy subjects with a relative abundance above 0.1%, depending on C. albicans colonization state. (c) Barplot of the mean relative abundances of the non-dominant fungal genera whose mean relative abundance, across subject, was above 0.1%, depending on C. albicans colonization state. Dominant genera are fungal genera detected in at least 50% of the studied healthy subjects with a relative abundance above 0.1%. Non-dominant genera are the remaining fungal genera. *p-value < .05, **p-value < .005.
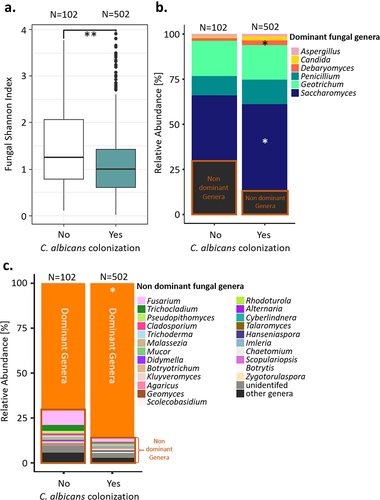
Table 1. Fungal species associated with C. albicans colonization in the Milieu Intérieur subjects. The prevalence of each fungal species within the subjects non-colonized by C. albicans and within the subjects colonized by C. albicans is represented in percentage and in ratio.
Figure 5. Diet and medical factors have a limited impact on C. albicans intestinal carriage and colonization. (a). Boxplot of the variation of C. albicans DNA levels according to the salting habits of the subjects. (b). Boxplot of the variation of C. albicans DNA levels according to the snacking habits of the subjects. (c). Association between C. albicans intestinal carriage and colonization and the mean corpuscular hemoglobin concentration. (left) Boxplot of the distribution of the mean corpuscular hemoglobin concentration depending on C. albicans colonization state. (right) scatterplot of the mean corpuscular hemoglobin concentration relative to intestinal C. albicans DNA levels. The regression line is represented in green, and the interval of confidence in gray. *p-value < .05, **p-value < .005.
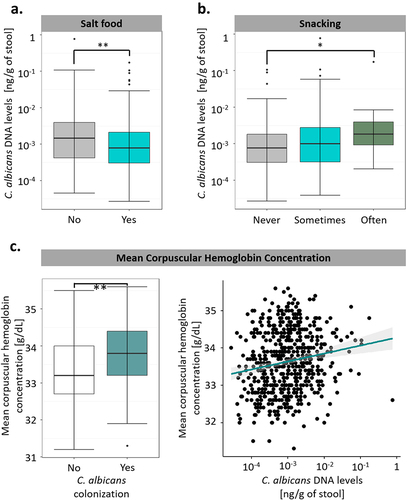
Figure 6. MC3R locus is associated with C. albicans intestinal colonization susceptibility. (a). Manhattan plot of single-nucleotide polymorphisms (SNPs) associated with C. albicans intestinal colonization susceptibility, identified by the genome-wide association study (GWAS) conducted on the 695 subjects of Milieu Intérieur. The x-axis represents the chromosomal position, and the y-axis represents the -log10(p-values) associated with each SNP. The green line represents the suggestive threshold for association (p-value <1.00 × 10⁻⁶). The gray line represents a threshold of 5.00 × 10⁻⁸. (b). Regional association plot for the C. albicans intestinal colonization-associated SNP, rs2870723 (purple diamond). Each dot represents a SNP, the color of the dots corresponds to the linkage disequilibrium of the neighboring SNPs with the top SNP. The x-axis represents the chromosomal position, the left y-axis represents the -log10(p-values) associated with each SNP (dots) and the right y-axis represents the recombination rate (blue line) occurring in each position of the locus.
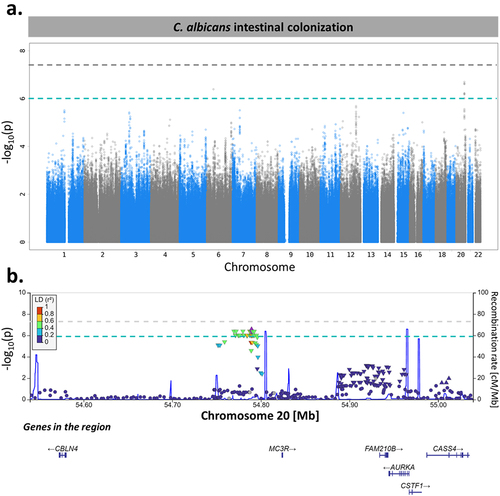
Figure 7. Association between rs2870723 genotypes and the levels of C. albicans intestinal carriage. (a) Boxplot of the variation of C. albicans DNA levels according to the rs2870723 genotype of the 695 Milieu Intérieur subjects. (b) Boxplot of the variation of C. albicans DNA levels according to the rs2870723 genotype of the 574 subjects colonized with C. albicans. (c) Percentage of subjects colonized by C. albicans (green) and not colonized (white) according to the rs2870723 genotype of the Milieu Intérieur subjects. The percentage of colonized and not colonized subjects within each genotype are noted in italics. ***p-value < .0005, ns non-significant.
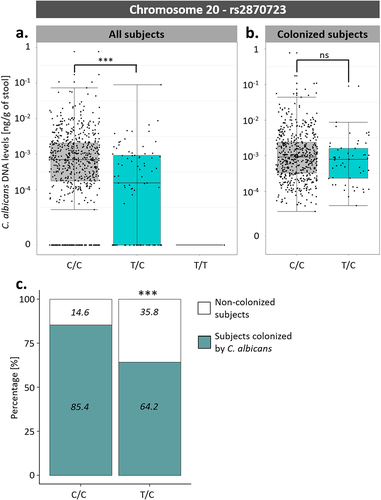
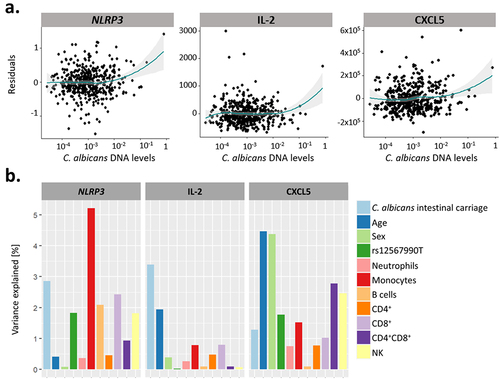
Figure 8. The extent of C. albicans intestinal carriage was associated with the expression levels of NLRP3 and the concentration of IL-2 and CXCL5 upon ex vivo C. albicans blood stimulation. (a). Residual plots of the association between C. albicans intestinal DNA levels and the expression of NLRP3, and the concentration of IL-2 and CXCL5 upon C. albicans stimulation. Linear model residuals are plotted in relation to the expression of NLRP3 or the concentration of IL-2 and CXCL5. The LOESS line is represented in green and the interval of confidence in gray. (b) Proportion of the expression and concentration variance explained by C. albicans intestinal carriage, age, sex, genetics, and proportions of immune cells for NLRP3, IL-2 and CXCL5, in response to C. albicans blood stimulation.
Supplemental Material
Download Zip (3 MB)Data availability statement
The data supporting the conclusions of this article are available in the European Genome-Phenome Archive under the accession codes EGAS00001002460 (https://www.ebi.ac.uk/ega/studies/EGAS00001002460) for the human genotype data and EGAS00001004437 (https://ega-archive.org/studies/EGAS00001004437) for the shotgun metagenomic sequences. ITS2-sequencing data and cytokine concentrations are available on Owey at the following DOI (10.48802/owey.0tnx-g641 for the ITS2 data and doi/10.48802/owey.g54a-kk20 for the cytokine concentrations data). The fungal load and C. albicans DNA level data are available in Supplementary Table S4. The associated demographic, lifestyle, environmental, and biochemical metadata can be obtained by contacting the coordinators of the consortium.