
Figures & data
Figure 1. Association of the gut microbiota composition with serum ferritin and executive function in the entire cohort and in men. (a-c) Volcano plots of the gut microbiota associated (p adjusted < 0.05) with serum ferritin (a), TDS (b), and PVF (c) in the entire cohort as calculated by ANCOM-BC from shotgun metagenomic sequencing, adjusting all three models for age, BMI, and sex; and for years of education in TDS, and PVF models. Only the microbial species associated with serum ferritin, TDS (b) and serum ferritin, and PVF (c) are shown. (d-f) Volcano plots of the gut microbiota associated (p adjusted < 0.05) with serum ferritin (d), TDS (e), and PVF (f) in men as calculated by ANCOM-BC from shotgun metagenomic sequencing, adjusting for age and BMI (serum ferritin, TDS, and PVF), and years of education (TDS, and PVF). Only the microbial species associated with serum ferritin and TDS (e) and SF and PVF (f) are shown. The log2 fold change of the association with a unit change in the ANCOM-BC-transformed variable values and the log10 p values adjusted for multiple comparisons using a sequential goodness of fit were plotted for each taxon. Significantly different taxa are colored according to phylum. TDS, total digit span; PVF, phonemic verbal fluency; BMI, body mass index.
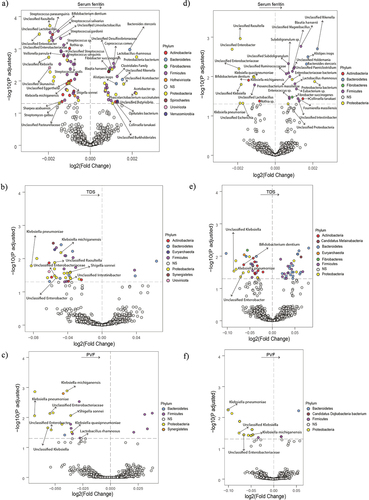
Table 1. Clinical and neuropsychological data of the Aging Imageomics cohort.
Figure 2. Association of the gut microbiota composition with serum ferritin and executive function in women. (a-c) Volcano plots of the gut microbiota associated (p adjusted < 0.05) with serum ferritin (a), TDS (b), and PVF (c) in women as calculated by ANCOM-BC from shotgun metagenomic sequencing, adjusting all three models for age and BMI; and for years of education in TDS, and PVF models. Only the microbial species associated with serum ferritin, TDS (b) and serum ferritin, and PVF (c) are shown. The log2 fold change of the association with a unit change in the ANCOM-BC-transformed variable values and the log10 p values adjusted for multiple comparisons using a sequential goodness of fit were plotted for each taxon. Significantly different taxa are colored according to phylum. TDS, total digit span; PVF, phonemic verbal fluency; BMI, body mass index.
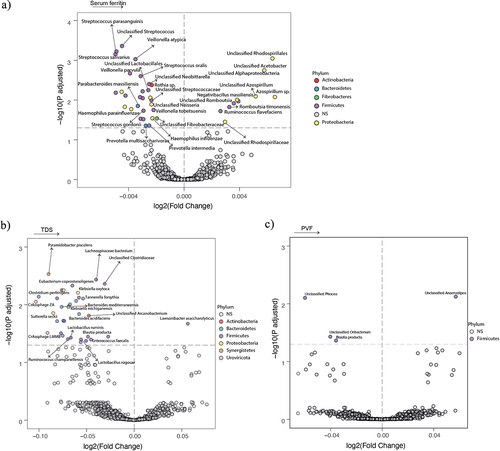
Figure 3. Association of serum ferritin and executive function with bacterial functionality in the Aging Imageomics cohort. (a-c) volcano plots of microbiome molecular functions associated (p adjusted < 0.05) with serum ferritin (a), PVF (b), and TDS (c) as calculated by ANCOM-BC from shotgun metagenomic sequencing, adjusting all three models for age, BMI, and sex; and for years of education in TDS, and PVF models. The log2 fold change of the association with a unit change in the ANCOM-BC-transformed variable values and the log10 p values adjusted for multiple comparisons using a sequential goodness of fit were plotted for each microbiome function. Significantly associated genes are colored in green (upregulated) or red (downregulated). d-e) Barplot plot of the KEGG pathway over-representation analyses (q value < 0.1) mapping the KEGG orthologues significantly associated with serum ferritin and PVF in the entire cohort (d) and in men (e). f) Gene-concept network depicting the linkage of significant KEGG orthologues participating in KEGG pathways related to lipopolysaccharide biosynthesis, sulfur relay system, and phenylalanine, arginine, and proline metabolism for serum ferritin and PVF in the entire cohort. TDS, total digit span; PVF, phonemic verbal fluency; BMI, body mass index.
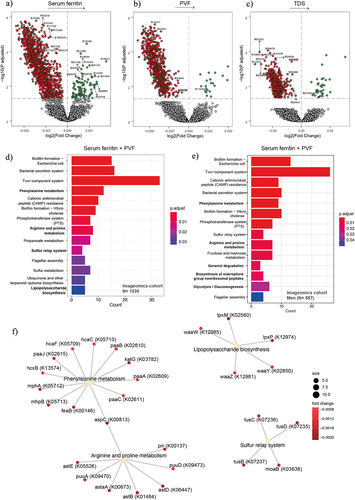
Figure 4. Association of serum ferritin and executive function with bacterial functionality in men. (a-c) Volcano plots of microbiome molecular functions associated (p adjusted < 0.05) with serum ferritin (a), PVF (b), and TDS (c) in men as calculated by ANCOM-BC from shotgun metagenomic sequencing, adjusting all three models for age and BMI; and for years of education in TDS, and PVF models. The log2 fold change of the association with a unit change in the ANCOM-BC-transformed variable values and the log10 p values adjusted for multiple comparisons using a sequential goodness of fit were plotted for each microbiome function. Significantly associated genes are colored in green (upregulated) or red (downregulated). d) Gene-concept network depicting the linkage of significant KEGG orthologues participating in KEGG pathways related to Glycolysis/Gluconeogenesis, biosynthesis of siderophore group nonribosomal peptides, geraniol degradation and phenylalanine, arginine, and proline metabolism for serum ferritin and PVF. TDS, total digit span; PVF, phonemic verbal fluency; BMI, body mass index.
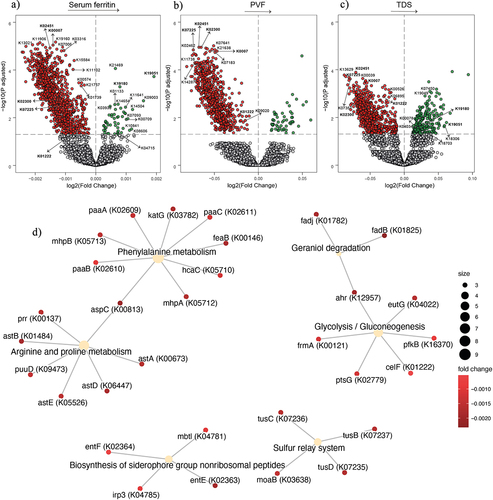
Figure 5. Association of serum ferritin and executive function with bacterial functionality in women. (a-b) Volcano plots of microbiome molecular functions associated (p adjusted < 0.05) with serum ferritin (a), and PVF (b), in women as calculated by ANCOM-BC from shotgun metagenomic sequencing, adjusting all models for age and BMI; and for years of education in PVF model. The log2 fold change of the association with a unit change in the ANCOM-BC-transformed variable values and the log10 p values adjusted for multiple comparisons using a sequential goodness of fit were plotted for each microbiome function. Significantly associated genes are colored in green (upregulated) or red (downregulated). c) Barplot plot of the KEGG pathway over-representation analyses (q value < 0.1) mapping the KEGG orthologues significantly associated with serum ferritin and PVF in women. d) Gene-concept network depicting the linkage of significant KEGG orthologues participating in KEGG pathways related to glyoxylate and dicarboxylate metabolism and two-component system for serum ferritin and PVF. PVF, phonemic verbal fluency; BMI, body mass index.
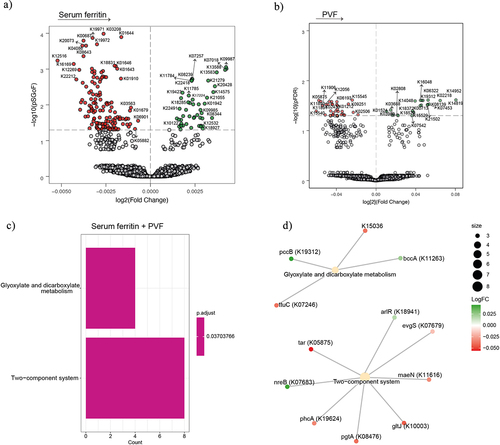
Figure 6. Plasma metabolomics associated with serum ferritin, executive function, and semantic memory in the entire cohort. Boxplots of the normalized variable importance measure (VIM) (a and c) and SHAP summary plots (b and d), for the metabolites associated with the SF levels measured by HPCL-ESI-MS/MS in positive (a) and negative (c) models. (e and f) Heatmap displaying the Spearman correlation (adjusted by age, sex, body mass index, and education years) between PVF, SVF, and TDS and the plasma metabolomics in positive mode (e) and negative mode (f). Significant associations are shown with a cross: **** <0.001, ***<0.01, **<0.05, *<0.1.
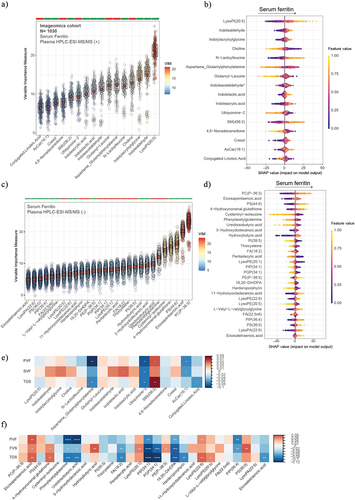
Figure 7. Plasma metabolomics associated with serum ferritin, executive function, and semantic memory in men. Boxplots of the normalized variable importance measure (VIM) (a and c) and SHAP summary plots (b and d), for the metabolites associated with the serum ferritin levels measured by HPCL-ESI-MS/MS in positive (a) and negative (c) models. (e and f) heatmap displaying the Spearman correlation (adjusted by age, body mass index, and education years) between PVF, SVF, and TDS and the plasma metabolomics in positive mode (e) and negative mode (f). Significant associations are shown with a cross: **** <0.001, ***<0.01, **<0.05, *<0.1. PVF, phonemic verbal fluency; SVF, semantic verbal fluency; TDS, total digit span.
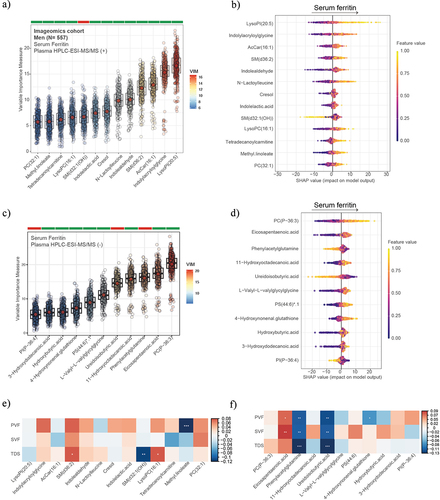
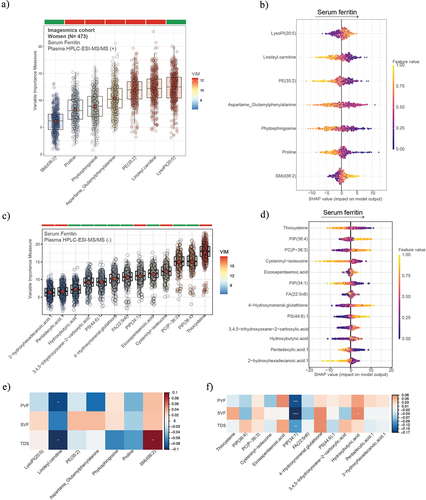
Figure 8. Plasma metabolomics associated with serum ferritin, executive function, and semantic memory in women. Boxplots of the normalized variable importance measure (VIM) (a and c) and SHAP summary plots (b and d), for the metabolites associated with the serum ferritin levels measured by HPCL-ESI-MS/MS in positive (a) and negative (c) models. (e and f) Heatmap displaying the Spearman correlation (adjusted by age, body mass index, and education years) between PVF, SVF, and TDS and the plasma metabolomics in positive mode (e) and negative mode (f). Significant associations are shown with a cross: **** <0.001, ***<0.01, **<0.05, *<0.1. PVF, phonemic verbal fluency; SVF, semantic verbal fluency; TDS, total digit span.
Supplementary.xlsx
Download MS Excel (6.2 MB)Data availability statement
We will upload the data to Dryad.