Figures & data
Figure 1. Experimental design and change of body weight and bone length.
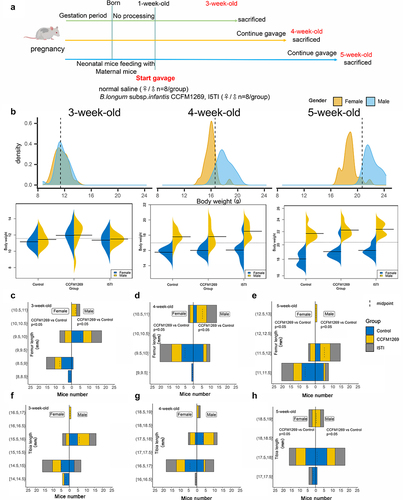
Figure 2. Alizarin Red and TRAP staining of femur and tibia.
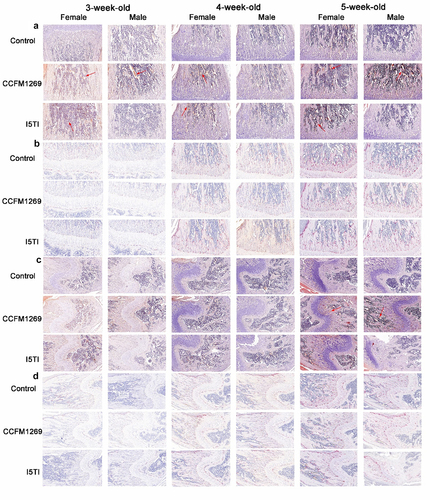
Figure 3. Effects of B. longum subsp. infantis on the serum osteogenic factors.
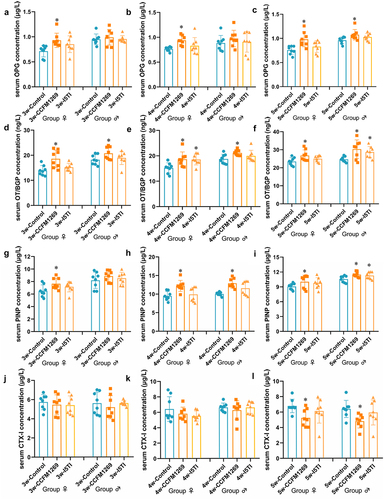
Figure 4. Effects of B. longum subsp. infantis on the gut microbiota of 3-week-old mice.
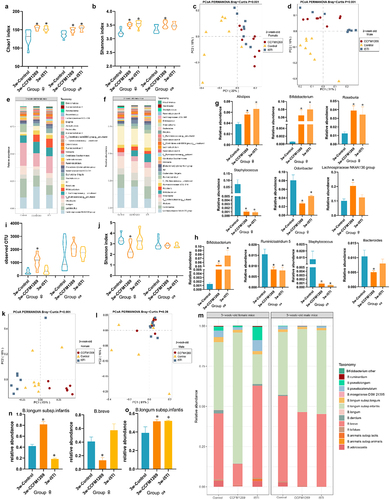
Figure 5. Effects of B. longum subsp. infantis on the gut microbiota of 4-week-old mice.
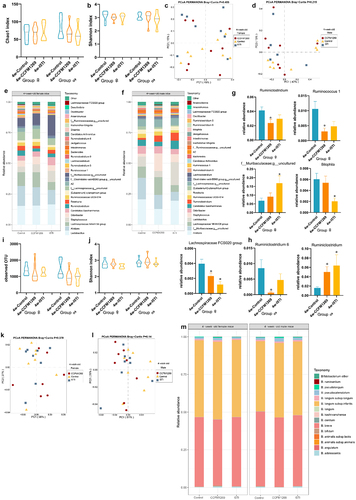
Figure 6. Effects of B. longum subsp. infantis on the gut microbiota of 5-week-old mice.
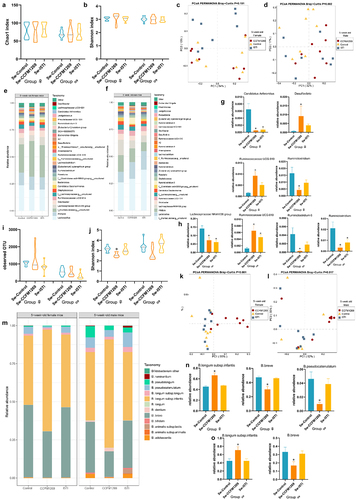
Figure 7. Effects of B. longum subsp. infantis CCFM1269 on fecal metabolites.
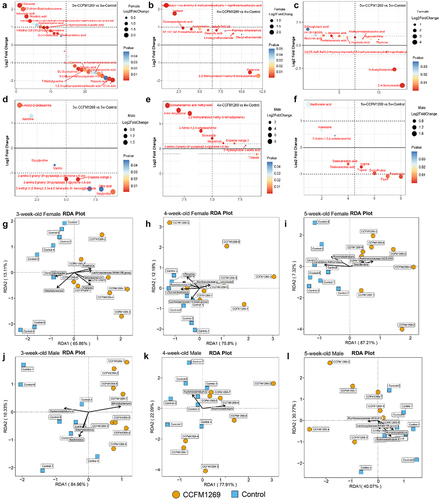
Figure 8. Co-existing metabolites of different age groups and RDA analysis between differential metabolites and OPG, OT/BGP, PINP, femur length, and tibia length.
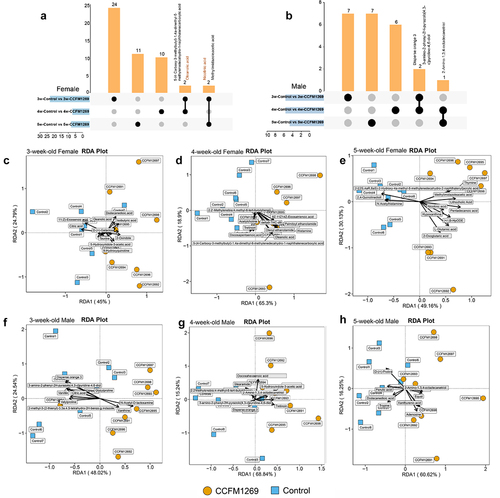
Figure 9. Effects of B. longum subsp. infantis on serum growth factors.
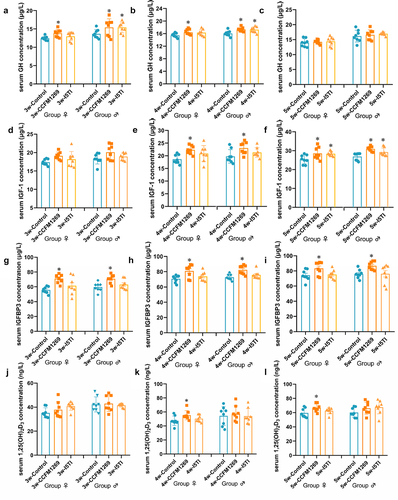
Figure 10. Effects of B. longum subsp. infantis on the PI3K/AKT pathway at the transcript level.
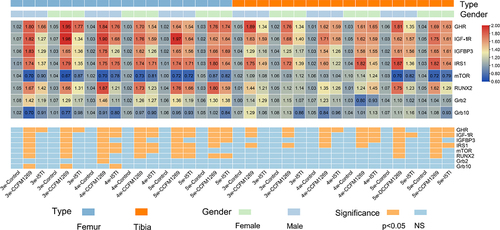
Figure 11. Effects of B. longum subsp. infantis on the PI3K/AKT pathway at the translation level of the femur.
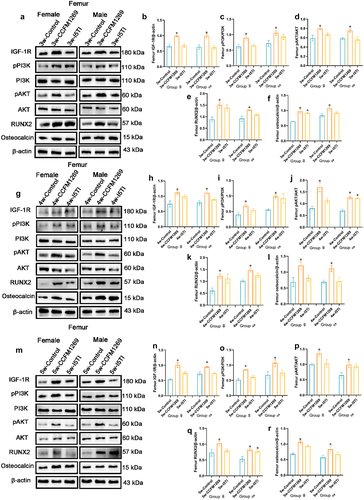
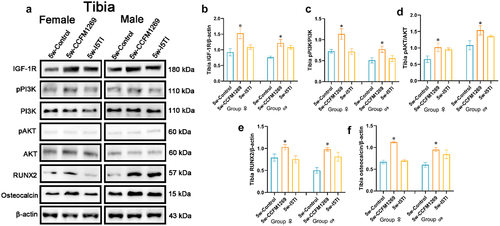
Figure 12. Effects of B. longum subsp. infantis on PI3K/AKT pathway at translation level of tibia.