
Figures & data
Figure 1. Compositionally distinct gut microbiota classes (GMCs) in feces of 1-month-old infants exhibit differential microbiota maturity and relate to the relative risk (RR) of overweight/obesity (OW/OB) at age 2 years.
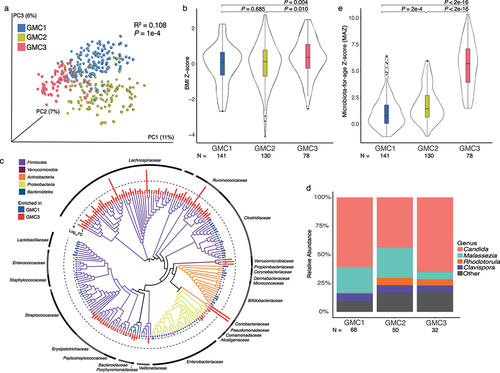
Table 1. Infant gut microbiota classes (GMCs) exhibit significantly different relative risk ratios (RRs) of developing OW/OB phenotypes at age 2 years.
Figure 2. High-risk GMC3 and lower-risk GMC1 exhibit distinct metabolic productivity and functional capacities.
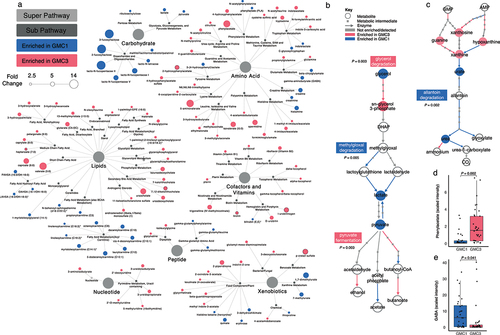
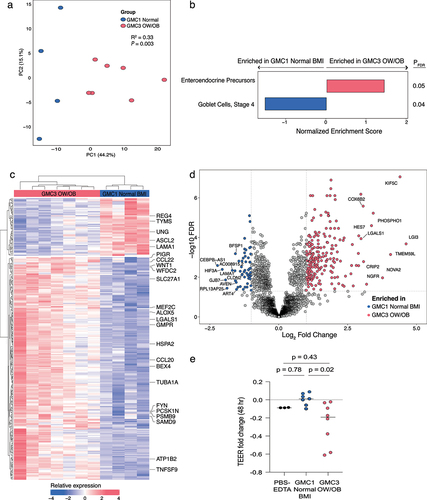
Figure 3. Cell-free fecal products from GMC3 infant microbiomes who developed OW/OB phenotypes in childhood reprogram Caco-2 enterocyte transcription.
Supplemental Material
Download MS Word (18 KB)Microbiome_Childhood_Obesity_Figures_20230523_EPS.rar
Download (7.5 MB)MicrobiomeObesity2YO_SupplementaryTables_20230523.xlsx
Download MS Excel (564.8 KB)Data availability statement
All raw sequences are deposited in the European Nucleotide Archive (Study PRJEB52295 and PRJEB13896) and in the SRA Bioproject PRJNA648818. All additional datasets and materials are available from the corresponding author upon reasonable request.