
Figures & data
Figure 1. Experimental design of the study. a) sample collection: stool samples were collected from 10 patients before starting the antibiotic therapy (T0), after 10 days of therapy (T1) and 30 days after the end of therapy (T2). b) wet lab: proteins extracted from stool samples were processed according to the FASP protocol to obtain peptide mixtures, which were in turn separated by LC (78-min gradient) and analyzed with an Orbitrap Exploris 480 mass spectrometer. c) bioinformatic analysis: peptide identification and quantification from mass spectra was carried out using proteome Discoverer (with a collection of gut metagenomes and the UniProt reference human proteome as sequence databases), while Unipept and eggNOG-mapper allowed taxonomic and functional annotation, respectively. Meta4P was used to parse and aggregate data and statistical analysis (paired t test) was performed with Perseus.
Figure 2. Abundance, richness, and beta diversity based on microbial and human peptide data. Each patient is marked with a different shape; each timepoint is marked with a different color. P-values obtained upon paired t-test comparison between timepoints are shown. a) scatterplot showing the log-transformed ratio between the relative abundance of microbial (M) and human (H) peptides measured in the samples. A positive M/H log ratio indicates higher abundance of microbial peptides; a negative M/H log ratio indicates higher abundance of human peptides. b) scatterplot showing the number of unique microbial peptides quantified in the samples. c) scatterplot showing the number of unique human peptides quantified in the samples. d) Principal component analysis (PCA) plot illustrating beta diversity between samples. Ellipses indicate 95% confidence level. The percentages of variation explained by the first two components are shown in x- and y-axis, respectively.
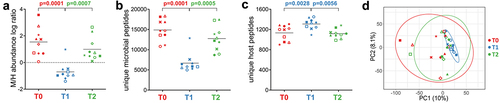
Figure 3. Relative abundance of top microbial phyla and orders. Peptide abundances were normalized based on the total abundance of microbial peptides in each sample, log-transformed and expressed as a color gradient (see legend in the figure bottom). The abundance of each taxon was calculated as the sum of the abundances of all peptides assigned taxonomically to that taxon by Unipept. Values measured for each of the 10 patients (P01-P10) in the three timepoints analyzed (T0, T1, T2) are shown in the heatmaps. Phylum abbreviation is given in parentheses. Statistically significant differences between timepoints are marked by asterisk(s) placed between the timepoints under comparison (* = p < .05; ** = p < .01; paired t test). a) top 6 phyla detected in the GM of the 10 patients analyzed in the study. b) top 12 orders detected in the GM of the 10 patients analyzed in the study.
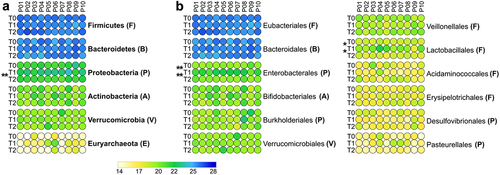
Figure 4. Differential microbial genera. Peptide abundances were normalized based on the total abundance of microbial peptides in each sample, log-transformed and expressed as a color gradient (see legend in the figure bottom). The relative abundance of each genus was calculated as the sum of the abundances of all peptides assigned taxonomically to that genus by Unipept. Values measured for each of the 10 patients (P01-P10) in the three timepoints analyzed (T0, T1, T2) are shown. The initial of the phylum to which each genus belongs is given in parentheses (B, Bacteroidetes; F, Firmicutes; P, Proteobacteria). Statistically significant differences between timepoints are marked by asterisk(s) placed between the timepoints under comparison (* = p < .05; ** = p < .01; *** = p < .001; paired t test). Genera with significantly lower abundance in T1 compared to T0 and/or T2 are on the left; genera with significantly higher abundance in T1 compared to T0 and/or T2 are on the right. In both cases, genera are ordered based on the phylum to which they belong and then in alphabetical order. Differential genera associated with less than 3 unique peptides are not shown.
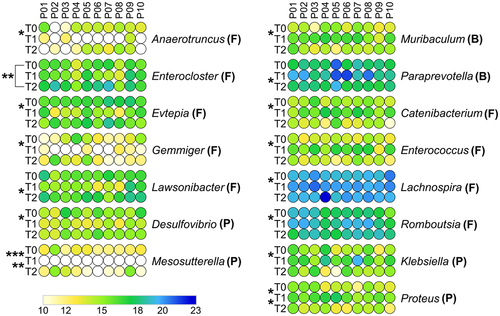
Figure 5. Selection of Firmicutes-specific functions with differential abundance between the timepoints analyzed. Each patient is marked with a different shape; each timepoint is marked with a different color. Q-values (FDR) obtained upon paired t-test comparison between timepoints are shown.
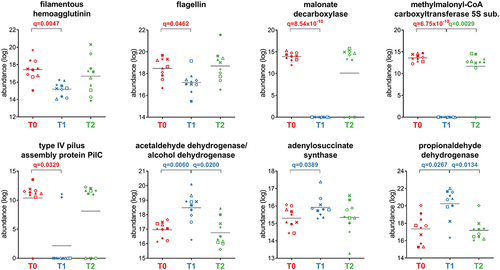
Figure 6. Selection of Bacteroidetes-specific functions with differential abundance between the timepoints analyzed. Each patient is marked with a different shape; each timepoint is marked with a different color. Q-values (FDR) obtained upon paired t-test comparison between timepoints are shown.
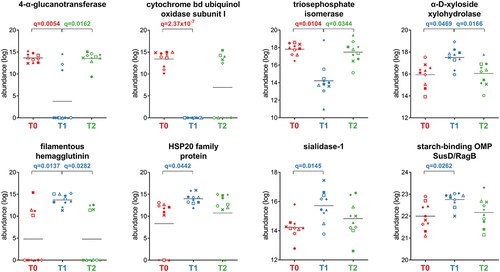
Figure 7. Selection of Proteobacteria-specific functions with differential abundance between the timepoints analyzed. Each patient is marked with a different shape; each timepoint is marked with a different color. Q-values (FDR) obtained upon paired t-test comparison between timepoints are shown.
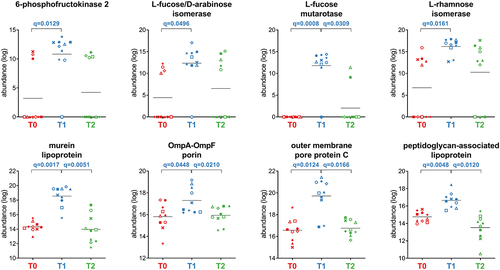
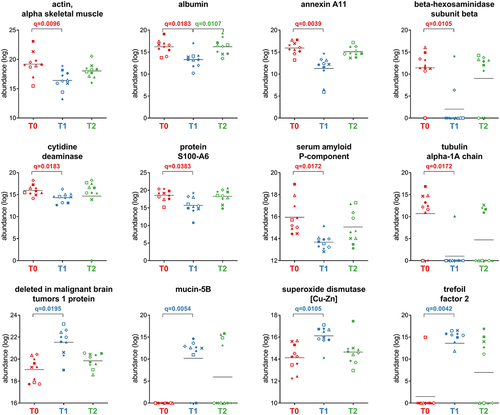
Figure 8. Selection of host proteins with differential abundance between the timepoints analyzed. Each patient is marked with a different shape; each timepoint is marked with a different color. Q-values (FDR) obtained upon paired t-test comparison between timepoints are shown.
Suppl Table S1.xlsx
Download MS Excel (14.5 KB)Suppl Table S2.xlsx
Download MS Excel (16.8 KB)Suppl Figure S2.tiff
Download TIFF Image (1.3 MB)Suppl Figure S1.tiff
Download TIFF Image (1.8 MB)Suppl Dataset S1.xlsx
Download MS Excel (4.1 MB)Suppl Dataset S2.xlsx
Download MS Excel (295.5 KB)Suppl Figure S3.tiff
Download TIFF Image (1,014.4 KB)Supplementary file legends.docx
Download MS Word (45 KB)Data availability statement
The mass spectrometry proteomics data (including peptide identification, quantification and annotation tables) have been deposited to the ProteomeXchange Consortium via the PRIDECitation79 partner repository with the dataset identifier PXD042946.