
Figures & data
Figure 1. (a) Serum levels of anti-CdtB antibodies (delta of post-inoculation levels vs. baseline levels) in controls and CdtB-inoculated rats (CdtB). (b) Stool wet weight (%) in controls and CdtB rats. (c) Serum levels of anti-vinculin antibodies in controls and CdtB rats. The Mann-Whitney test was used to compare groups and a p-value <0.05 was considered significant.
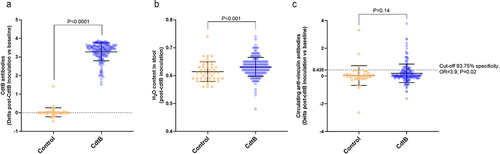
Figure 2. (a) Small intestinal (duodenum and ileum), large intestinal (cecum) and stool microbial alpha diversity (Shannon entropy) of CdtB rats (blue) and controls (orange). (b) Small bowel (duodenum and ileum), large intestine (cecum) and stool microbial beta diversity of CdtB rats (shades of blue) and controls (shades of yellow/orange). (c) Relative abundances of all bacterial genera throughout the small bowel (duodenum and ileum), large intestine (cecum) and stool of CdtB rats and controls.
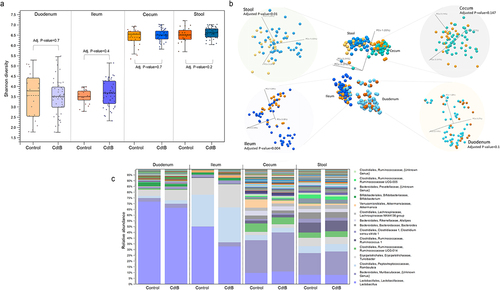
Figure 3. (a) Principal coordinate analysis (PCA) plot of ileal microbiome beta diversity in CdtB rats (blue) and controls (red). (b) PCA plot of ileal microbiome beta diversity in CdtB rats and controls, colored according to differences in alpha diversity (Shannon index). (c) PCA plot of ileal microbiome beta diversity showing the different clusters of CdtB rats (cluster 0 - green, cluster 1 - blue and cluster 2 - purple) and controls (red), after clustering analysis using the K-Means clustering algorithm.
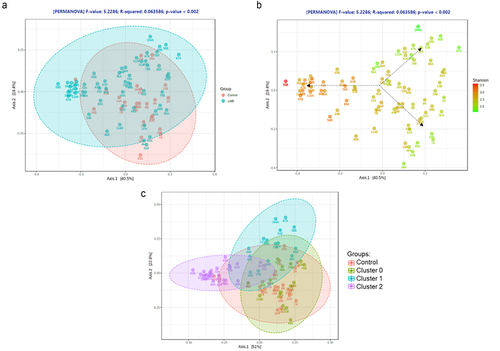
Figure 4. (a) Common altered host ileal tissue pathways in different microbiome-based clusters of CdtB rats, based on whole transcriptome analysis. C1 – cluster 2 vs. Control; C2 – cluster 1 vs. Control; C3 – cluster 0 vs. Control; C4 – CdtB (all rats) vs. Control. (b) Zinc finger (zfp), integrins (itg) and talin (Tln) mRNA expression profiles in control (orange) and CdtB (blue) rats after meta-analysis of differently expressed genes associated with the global effects of CdtB. Hypergeometric distribution was used to analyze the enrichment of pathways, gene ontology, domain structure, and other ontologies. The topGO R library was used to determine local similarities and dependencies between GO terms in order to perform Elim pruning correction. DEseq2 was used to calculate fold changes and p-values. Differentially expressed mRNAs had absolute fold change (FC) ≥ 1.25 and adj. P-value (FDR P-value) <.05.
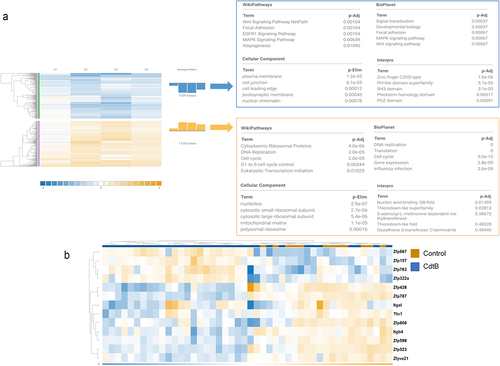
Figure 5. (a) Differentially expressed genes in host ileal tissues of cluster 2 CdtB rats as compared to controls. (b) Gene ontology (GO) enriched pathways in ileal tissues of cluster 2 CdtB rats as compared to controls. DEseq2 was used to calculate fold changes and p-values. Differentially expressed mRNAs had absolute fold change (FC) ≥ 1.25 and adj. P-value (FDR P-value) <0.05. Hypergeometric distribution was used to analyze the enrichment of pathways, gene ontology, domain structure, and other ontologies. The topGO R library was used to determine local similarities and dependencies between GO terms in order to perform Elim pruning correction.
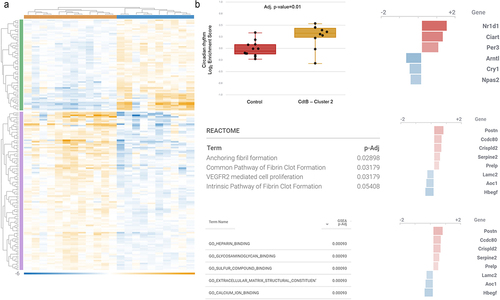
Figure 6. Differentially expressed host miRNAs in CdtB-induced dysbiosis. (a) Principal component analysis of miRNA expression in clusters of different microbiomes emerged after CdtB exposure. (b) Venn diagram of the differentially expressed (DE) miRNAs in each microbiome cluster. Cluster 0 did not show any differently expressed miRNAs when compared to controls. (c) DE miRNAs in cluster 1. (d) DE miRNAs in cluster 2. (e). Top 20 DE miRNAs in cluster 1. (f) All DE miRNAs in cluster 2. Differentially expressed miRNAs have absolute fold change (FC)≥1.5 and adj. P-value (FDR P-value)<0.1. FDR p-values were obtained through multi-factorial statistics based on a negative binomial generalized linear model (GLM) using CLC Genomics Workbench v.20 (Wald test). Heatmaps use relative color scheme, where the minimum and maximum values in each row are used to convert values to colors. Euclidean distance and average linkage were used for the creation of heatmaps using morpheus software (https://software.Broadinstitute.org/morpheus).
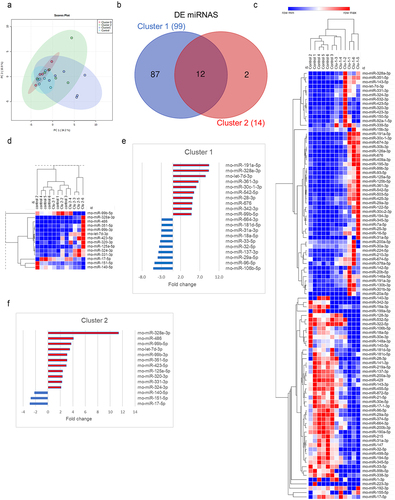
Figure 7. Enrichment analysis of DE host mRNAs that were the targets of DE miRNAs in clusters 2 and 1. Predicted and validated miRNA targets were uploaded to ShinyGO v.0.76.1 to obtain the gene ontology (GO) terms for cellular components and biological processes that were regulated by miRNAs in each cluster. (a) Top 20 dysregulated cellular components regulated by miRNAs in cluster 2. (b) Top 20 dysregulated biological processes controlled by miRNAs in cluster 2. (c) Top 20 dysregulated cellular components regulated by miRNAs in cluster 1. (d) Top 20 dysregulated biological processes controlled by miRNAs in cluster 1. Enrichment analysis in ShinyGO v.0.76 was calculated based on hypergeometric distribution followed by false discovery rate (FDR) correction (FDR <0.05). No background list was used for enrichment analysis.
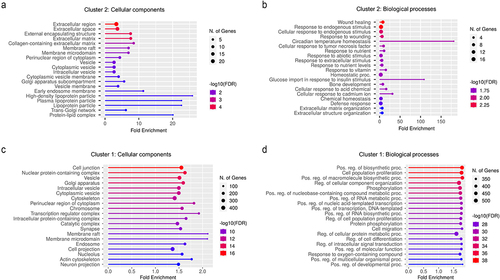
Table 1. Relevant miRNAs and targets previously identified in the literature and associated with IBS pathophysiology in clinical and animal studies.
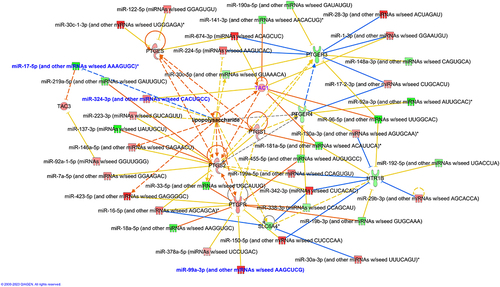
Figure 8. miRNA-mRNA interactions in mechanisms associated with pain in IBS. DE genes involved in mechanisms that were previously associated with pain in IBS were added to the network along with their DE interacting miRNAs from our dataset. LPS was added to the network for activity pattern prediction. Activation/inhibition predictions were obtained using the MAP prediction tool on IPA. Targets with names in purple and miRnas with names in blue were dysregulated in cluster 1 and 2 in the same direction. Targets and miRNAs with names in black were dysregulated in cluster 1 only.
Supplementary material_CdtB_R3.docx
Download MS Word (5.3 MB)Supplemental File 1.xlsx
Download MS Excel (4.4 MB)Data availability statement
The datasets generated during this study are available in the National Center for Biotechnology Information (NCBI) BioProject Repository https://www.ncbi.nlm.nih.gov/bioproject under BioProject PRJNA858800.