
Figures & data
Figure 1. F. nucleatum activates NF-κB in HT-29 independently of MyD88 and NOD1. (a) Average NF-κB activity in HT-29-NFκB reporter system (10% vol/vol), induced by F. nucleatum supernatant or control media for 24 h. (b) HEK-NFκB reporter (WT, black bars) and deleted for MYD88 (MYD88−/−, gray bars) cells were incubated with F. nucleatum supernatant or control media for 24 h. (c) Treatment of HEK-NFκB reporter cells deleted for MYD88−/− with control media, F. nucleatum supernatant or the NOD1 ligand (IE-DAP) for 24 h in presence or absence of a NOD1 inhibitor (ML130). NF-κB activation was measured by SEAP secretion and expressed as mean ± SD fold change toward unstimulated cells. Data represent ≥ 3 independent experiments performed in technical duplicate or triplicate. Data analysis: Mann-Whitney test was used, ****P < .0001; ***P < .001; **P < .01; *P < ,05; P < .05 was considered as not significant (ns).
Figure 2. F. nucleatum supernatant activates NF-κB via ALPK1, TIFA and TRAF6. (a) WT (gray dots), ALPK1−/− (green dots), TIFA−/− (red dots) and TRAF6−/− (bleu dots) HEK NF-κB-reporter cells were stimulated with F. nucleatum supernatant or control media for 24 h. NF-κB activation was measured by SEAP secretion and expressed as mean ± SD fold change toward unstimulated cells. (b) TIFA−/− HEK NF-κB-reporter cells transfected (gray dots) or not (red dots) with pTIFA-FLAG and stimulated with F. nucleatum supernatant or control media for 24 h. NF-κB activation was measured by SEAP secretion and expressed as mean ± SD fold change toward unstimulated cells. (c,d) TIFA-GFP HeLa cells were treated with control siRNA or ALPK1 specific siRNA prior to transfection with empty pCMV or pCMV-ALPK1 and were left unstimulated (control) or stimulated with ADP-H (10−6 M), F. nucleatum supernatant or control media for 24 h. Representative pictures of cells with TIFAsomes after 30 min of stimulation are in C (scale bar: 20 μm) and the graph showing the TIFAsomes quantification per cell in each condition is in d (control siRNA in black bars, siRNA ALPK1 in white bars and siRNA ALPK1 + pALPK1 in gray bars). (e) WT (gray dots) and TIFA−/− (red dots) HT-29 NF-κB reporter cells were stimulated with F. nucleatum supernatant or control media for 24 h. NF-κB activation was measured by SEAP secretion and expressed as mean ± SD fold change toward unstimulated cells. (f) CXCL8 relative expression to GAPDH in WT (black bars) and TIFA−/− (red bars) in HT29 stimulated with stimulated with ADP-H (10−6M), F. nucleatum supernatant or control media for 6 h expressed as 2−ΔΔCt toward unstimulated cells. g. IL-8 ELISA performed on WT (gray dots) and TIFA−/− (red dots) cells unstimulated (control) or treated with F. nucleatum supernatant or control media for 24 h. IL8 concentration was expressed in pg/ml. Data represent ≥ 3 independent experiments performed in duplicate or triplicate. Statistical significance was assessed using Mann-Whitney test (B, E-G) or one-way ANOVA followed by Tukey’s multiple comparisons test (A and D, for D, the samples were compared to their respective control transfected with control siRNA, siRNA ALPK1, siRNA ALPK1 + ALPK1). ****P < .0001; ***P < .001; **P < .01; *P < .05; P < .05 was considered as not significant (ns).
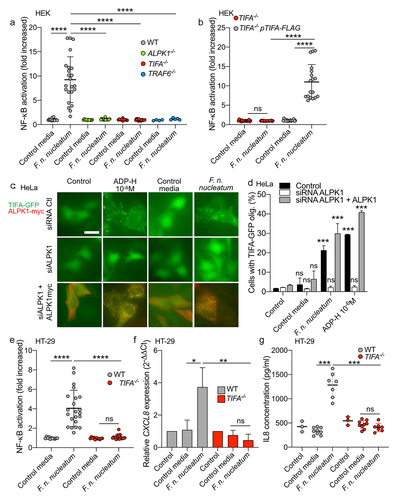
Figure 3. Fusobacterium species activate NF-κB via the ALPK1-TIFA pathway. (a) WT (gray dots) and TIFA−/− (red dots) HT-29 NF-κB-reporter cells were stimulated with supernatants derived from different Fusobacterium spp. Or control media for 24 h. (b) WT (gray dots) and ALPK1−/− (green dots) HEK NF-κB-reporter cells were incubated with supernatants derived from different Fusobacterium spp. Or control media for 24 h. NF-κB activation was measured by SEAP secretion and expressed as mean ± SD fold change toward unstimulated cells. Data represent ≥ 3 independent experiments performed in triplicate. Data analysis: Mann-Whitney test was used, ****P < ,0001; ***P < ,001; **P < ,01; *P < ,05; P < 0.05 was considered as not significant (ns).
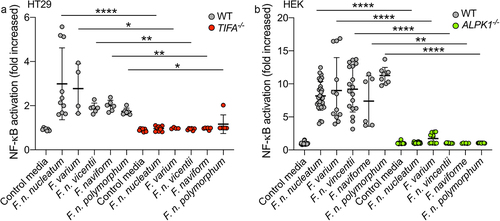
Figure 4. F. nucleatum enzymes HldA (Fn1786) and HldC (Fn0930) from the heptose biosynthesis pathway are functional. (a) Schematic view of the heptose biosynthesis pathway. (b) HT-29-NF-κB reporter WT (black bars) or TIFA−/− (green bars) cells were stimulated for 24 h with lysates from E. coli; ΔhldE; ΔhldE transformed with plasmid controls (pBAD and/or pGB), with hldA (pGB-hldA), with hldC (pBAD-hldC), with hldA (pGB-hldA) and hldC (pBAD-hldC) from F. nucleatum or ADP-H (10−6 M). NF-κB activation was measured by SEAP secretion and expressed as mean (%) ± SD fold change toward supernatant-stimulated cells. Data represent ≥ 3 independent experiments performed in triplicate. Data analysis: one-way ANOVA followed by Tukey’s multiple comparisons test was used, ****P < .0001; ***P < .001; **P < .01; *P < .05; P <.05 was considered as not significant (ns).
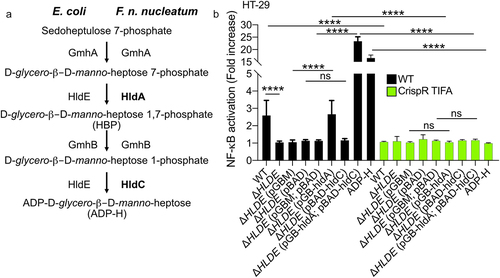
Figure 5. F. nucleatum NF-κB activating molecule has the biological features of the ALPK1 ligand ADP-heptose. (a,b) cells were treated with digitonin and non-inoculated control medium, F. nucleatum supernatants, HBP (10−5M) or ADP-H (10−8M). in A: Representative pictures of cells with TIFAsomes at 30 min in TIFA-GFP-expressing HeLa cells (scale bar: 20 μm). In B, quantification of TIFAsomes in each condition as in a from three independent experiments performed in triplicate. (c) F. nucleatum supernatant was untreated, treated with calf intestine alkaline phosphatase (CIP), with C. adamanteus phosphodiesterase (PDE) or their respective buffer (CIP buffer and PDE buffer) prior to stimulation of HT-29-NF-κB reporter cells for 24 h. NF-κB activation was measured by SEAP secretion and results were expressed as mean change (%) ± SD toward F. nucleatum supernatant-stimulated cells. Data represent ≥ 3 independent experiments performed in triplicate. Statistical significance was assessed using one-way ANOVA followed by Tukey’s multiple comparisons test (for B, the samples were compared to their respective control: control for ADP-H and HBP and control media for F. nucleatum supernatants). ****P < ,0001; ***P < ,001; **P < ,01; *P < ,05; P < 0.05 was considered as not significant (ns).
Figure 6. Butyrate synergizes with ADP-H-dependent activation of NF-κB.A-B HEK (a) and HT-29 (b) NF-B-reporter cells were left untreated (control) or stimulated with ADP-H (10−8M to 8.10−7M) with (gray bars) or without (black bars) butyrate (2 mM). NF-κB activation was measured by SEAP secretion and expressed as the mean ± SD fold change toward unstimulated cells. Data represent three independent experiments performed in triplicate. (c) Real-time qPCR (RT-qPCR) showing ALPK1 and TIFA gene expression in HT-29 cells stimulated with 2 mM butyrate for 6 h. Results were normalized to GAPDH and expressed as 2−ΔΔCt toward unstimulated cells. Data represent three independent experiments performed in triplicate. Statistical significance was assessed using two-way ANOVA followed by Tukey’s multiple comparisons test. ****P < ,0001; ***P < ,001; **P < ,01; *P < ,05; P < 0.05, was considered as not significant (ns).
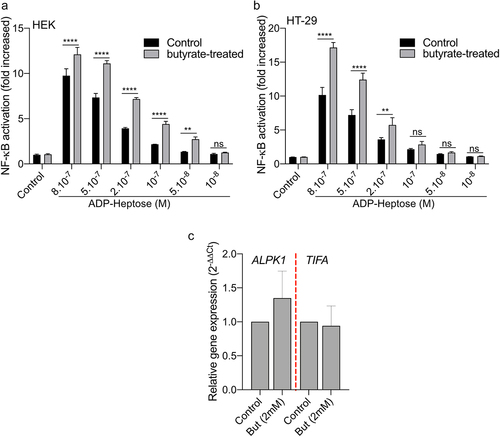
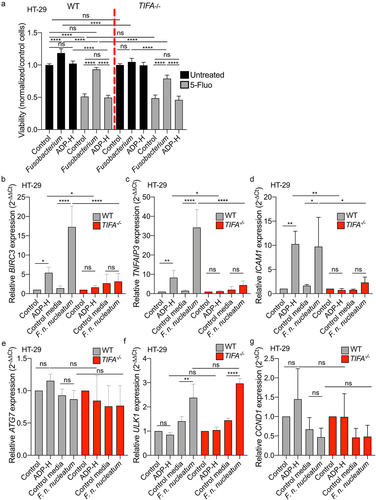
Figure 7. F. nucleatum increases HT-29 proliferation and activates anti-apoptotic but not autophagic genes expression via the TIFA pathway. (a) WT (left) or TIFA−/− (right) HT-29 cells were left untreated (control), stimulated with ADP-H (10−6M), control media or F. nucleatum supernatant prior treatment with 5-fluoroucil (5-Fluo, 100 μM, gray bars) or without treatment (black bars). Cell viability HT-29 cell viability was monitored with MTS assay and normalized to the MTS response of untreated cells. B-E. Real-time qPCR (RT-qPCR) showing BIRC3 (b), TNAIP3 (c), ICAM-1 (d), ATG7 (e), ULK1 (f) and CCND1 (g) relative expression to GAPDH in WT (left) or TIFA−/− (right) HT-29 cells, untreated (control), stimulated with ADP-H (10−6M), control media or F. nucleatum supernatant for 6 h. Results were normalized on GAPDH and expressed as 2−ΔΔCt toward unstimulated cells. Data represent ≥ 3 independent experiments. Statistical significance was assessed using one-way ANOVA followed by Tukey’s multiple comparisons test. ****P < .0001; ***P < .001; **P < .01; *P < .05; P <.05 was considered as not significant (ns).
Supplemental Material
Download MS Word (13.6 KB)Supplementary figS2 resub.tiff
Download TIFF Image (1.5 MB)Supplementary fig S1 resub.tiff
Download TIFF Image (389.4 KB)Supplementary Table S1.xlsx
Download MS Excel (10.9 KB)Data availability statement
All data are contained in the article and the supporting information.