
Figures & data
Figure 1. Participant flow diagram, including the number of participants at each of the trial stages. SSC = skin-to-skin contact. CAU = care-as-usual.
Figure 2. Mean daily skin-to-skin contact (SSC) duration in the SSC and care-as-usual (CAU) condition based on data derived from the intention-to-treat selection.
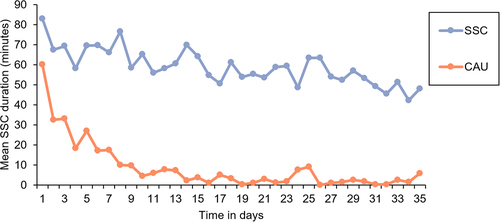
Table 1. Descriptive statistics and group comparisons of raw data for mother – infant dyads of the SKPPY study.
Figure 3. Alpha diversity indices between treatment (SSC) and control (CAU) group per sampling time point.
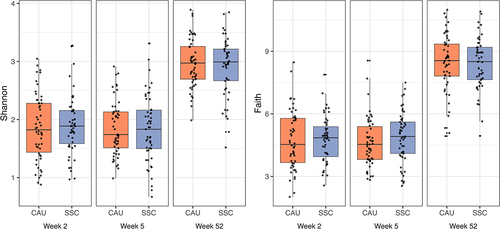
Figure 4. All samples plotted on the first 2 dimensions of a PCA of Euclidean distances of CLR transformed abundance values (Aitchison distance).
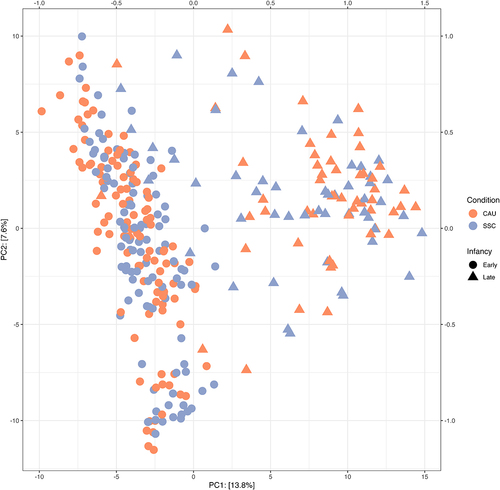
Figure 5. Heatmap of clr-transformed bacterial abundances that were either differentially abundant between treatment (SSC) and control (CAU) or important for the microbiota age model. The letter behind each genus indicates whether it was important for the microbiota age model (R, see corresponding section) or identified by any of the differential abundance analysis methods (M = Maaslin2, L = LinDA). The relative abundance values have been scaled to zero mean and unit variance in order to highlight differences in the variation relative to the mean level within each taxonomic group. The color scale has been limited to the interval [−1, 1].
![Figure 5. Heatmap of clr-transformed bacterial abundances that were either differentially abundant between treatment (SSC) and control (CAU) or important for the microbiota age model. The letter behind each genus indicates whether it was important for the microbiota age model (R, see corresponding section) or identified by any of the differential abundance analysis methods (M = Maaslin2, L = LinDA). The relative abundance values have been scaled to zero mean and unit variance in order to highlight differences in the variation relative to the mean level within each taxonomic group. The color scale has been limited to the interval [−1, 1].](/cms/asset/b085272c-6a56-413e-8f2c-bb1cf4f0d0e9/kgmi_a_2295403_f0005_oc.jpg)
Figure 6. Volatility (intra-individual Aitchison distance) between treatment (SSC) and control (CAU) group for the sample sequence from 2 to 5 weeks and 5 to 52 weeks.
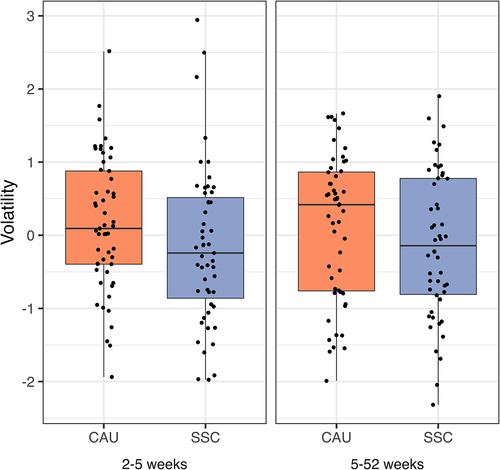
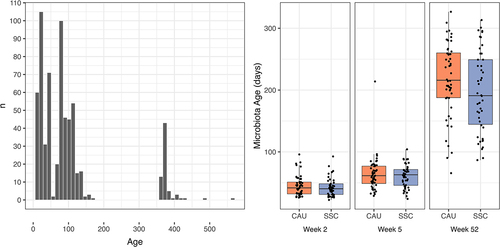
Figure 7. A. Age of sample collection for the samples used to train the Random Forest model. B. Predicted microbiota age for the samples analyzed in this study between treatment (SSC) and control (CAU) per time point.
Supplemental Material
Download PDF (553.8 KB)Data availability statement
The research data are part of an ongoing study but can be requested from C de Weerth ([email protected]) for scientific purposes.