
Figures & data
Figure 1. Luminal microbiota characteristics in chronic pouchitis patients, and comparison to the healthy fecal donor.
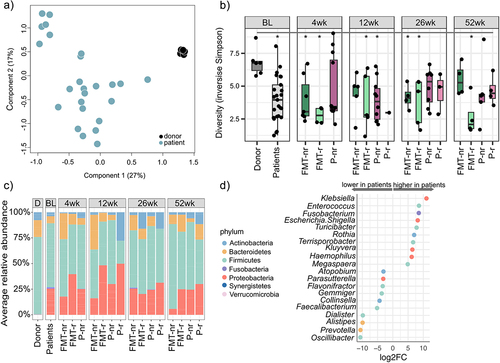
Figure 2. Chronic pouchitis patients had significant differences in the luminal microbiota composition at baseline, based on the pattern of the antibiotic use and type of antibiotics used.
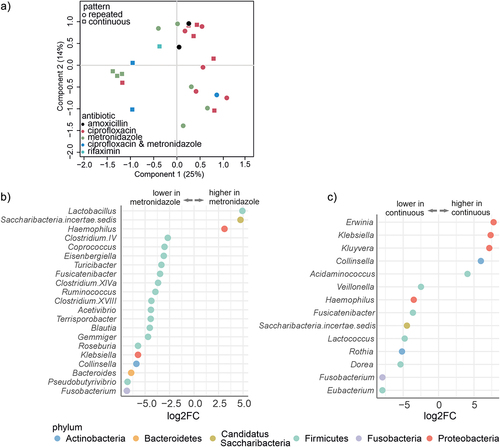
Figure 3. The effect of FMT on microbiota composition.
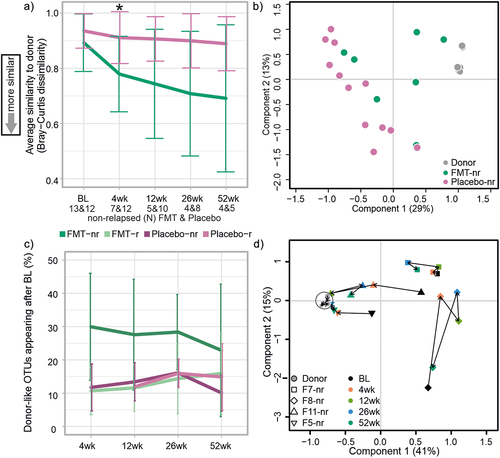
Figure 4. Post-FMT change in genus-level relative abundance.
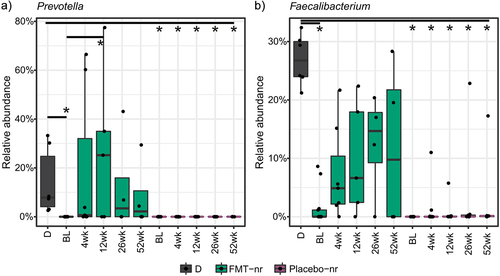
Figure 5. Average relative abundance of phylum-level taxa in the mucosal microbiota and difference between mucosal and luminal microbiota.
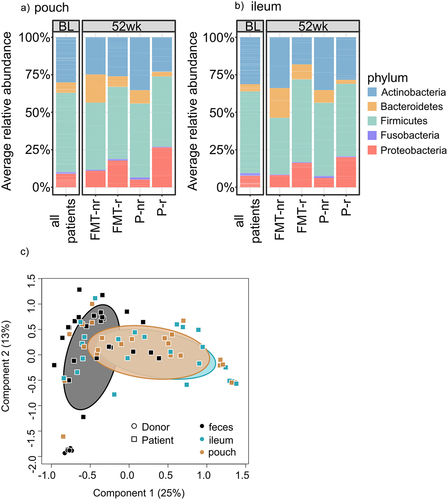
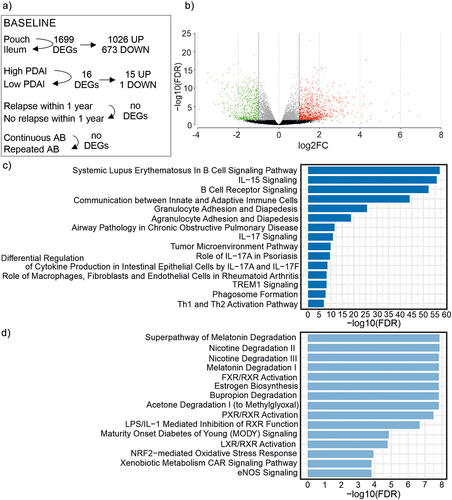
Figure 6. Baseline characteristics of mucosal gene expression.
Additional_File2.docx
Download MS Word (9.5 KB)Additional_File3.docx
Download MS Word (1.4 MB)Additional_file1.xlsx
Download MS Excel (129.7 KB)Data availability statement
The datasets generated and/or analyzed during the current study are available in the European Nucleotide Archive (ENA) repository with the accession number PRJEB52304 or by request.