
Figures & data
Figure 1. Workflow overview and variable selection process: A) initial datasets and the process of selecting candidate variables using statistical tests: DESeq2, chi-squared and Kruskal-Wallis. B) the bootstrap process repeat 50 times the creation of a random forest model used to variable selection and performance evaluation. C) visualization of three key performance metrics: mean Gini Decrease used to identify the most important variables, variable importance frequency heatmap, and a receiver operating characteristic (ROC) curve representing final model performance.
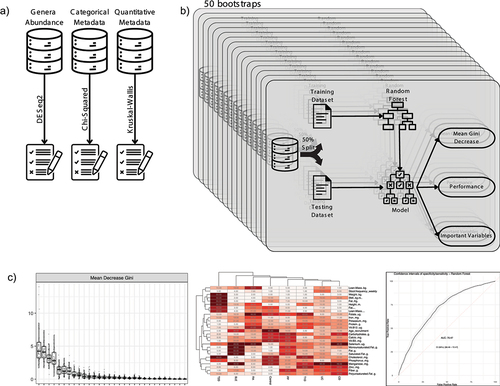
Table 1. Phenotypic characteristics of the study participants.
Figure 2. Beta diversity representation of gut microbiota in health and clinical conditions. the scatter plot displays the distribution of individuals, with axis 1 on the X-axis and axis 2 on the Y-axis. Each point on the scatter plot is color-coded to indicate the individual’s health or disease status. Boxplots are presented alongside the scatter plot for each health or disease condition. These boxplots depict the spread and central tendency of individuals across both axis 1 and axis 2.
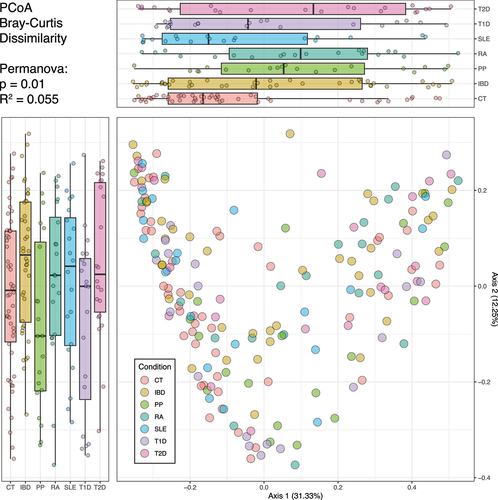
Figure 3. Heatmaps of variables frequency among important markers. A) frequency of the bacterial taxa among the selected variables. Taxa denoted in red met the inclusion criteria for the final model by appearing in at least 25 bootstraps for at least one health or disease state. B) frequency of qualitative phenotypic variables. All variables within this category were chosen for the final model. C) frequency of quantitative phenotypic variable. All variables in this category were selected as they met the selection criteria for at least one disease state.
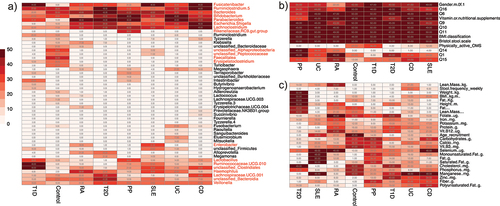
Table 2. Comparison of performance of disease predictive models using isolated and integrated gut microbiota and phenotypic variables.
Supp_Fig_4.eps
Download EPS Image (15.6 MB)Supp_Table_4.xlsx
Download MS Excel (11.3 KB)Supp_Table_5.xlsx
Download MS Excel (11.8 KB)Supp_Fig_2.eps
Download EPS Image (8.1 MB)Supp_Table_2.xlsx
Download MS Excel (11.7 KB)Supp_Table_3.xlsx
Download MS Excel (11.1 KB)Supp_Fig_1.eps
Download EPS Image (6.5 MB)Supp_Fig_3.eps
Download EPS Image (16.3 MB)Supp_Table_1.xlsx
Download MS Excel (9.8 KB)Data availability statement
Nucleotide sequence data used for this study are deposited in The European Nucleotide Archive (ENA) accession number PRJEB59338.