Figures & data
Figure 1. B. thetaiotaomicron-derived acetic acid correlated with recurrence in HCC. (a) Principal coordinate analysis (PCoA) plot of bacterial beta-diversity based on the Bray-Curtis dissimilarity according to the fecal metagenome sequencing data from HCC patients (recurrent group (n = 14) and non-recurrent group (n = 6). (b) Statistic result of Bray-Curtis distance according to the the fecal metagenome sequencing data of HCC patients (recurrent group (n = 14) and non-recurrent group (n = 6). (c) Histogram show the relative abundance between HCC patients (recurrent group (n = 14) and non-recurrent group (n = 6). (d) Box plot show the relative abundance of B. thetaiotaomicron between HCC patients (recurrent group (n = 14) and non-recurrent group (n = 6). (e) Schematic diagram depicting the enzyme in short chain fatty acid metabolism. (f) Box plot show the relative abundance of thioesterase gene ackA between HCC patients (recurrent group (n = 14) and non-recurrent group (n = 6). (g) Box plot show the relative abundance of thioesterase gene pta between HCC patients (recurrent group (n = 14) and non-recurrent group (n = 6). (h) Volcano plot revealed the differential abundant immune cell derived from EPIC. (i) Gene enrichment analysis base on the B. thetaiotaomicron abundance in HCC patients. (j) Real-time PCR detected the B. thetaiotaomicron abundance in HCC fecal samples. (k) Correlation between the expression of T cell effector marker and the relative abundance of B. thetaiotaomicron. (l) Correlation between the expression of macrophage marker and the relative abundance of B. thetaiotaomicron. (m) Correlation between the expression of macrophage marker and the relative abundance of B. thetaiotaomicron. (n) Correlation between the expression of the relative abundance of B. thetaiotaomicron and fecal acetate level. (o) Correlation between the expression of the relative abundance of B. thetaiotaomicron and serum acetate level.
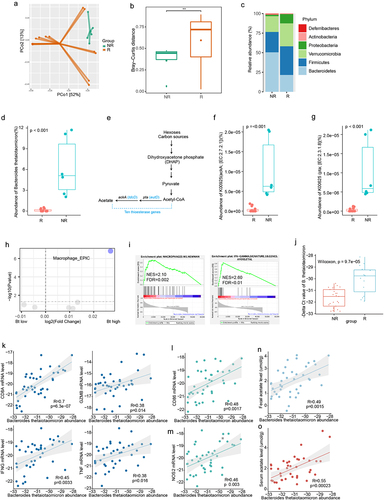
Figure 2. B.thetaiotaomicron-derived acetic acid participates in pro-inflammatory macrophages polarization and further promotes the function of cytotoxic CD8+ T cells. (a-d) real-time PCR was performed to measure the mRNA expression of CD86 (a) NOS2 (b) CD163 (c) and ARG1 (d) in TDM cells with indicated treatments. (n = 3). (e) Western-bolt was performed to measure the protein levels of CD86, NOS2, CD163 and ARG1 in TDM cells with indicated treatments. (n = 3). (f-g) flow cytometry was conducted to assess the levels of CD86 (f) and CD163 (g) in TDM cells with indicated treatments. (n = 3). (h-k) real-time PCR was performed to measure the mRNA expression of CD86 (h), NOS2 (i), CD163 (j) and ARG1 (k) in BMDM cells with indicated treatments. (n = 3). l. Western-bolt was performed to measure the protein levels of CD86, NOS2, CD163 and ARG1 in BMDM cells with indicated treatments. (n = 3). (m-n) flow cytometry was conducted to assess the levels of CD86 (m) and CD163 (n) in BMDM cells with indicated treatments. (n = 3). (o) The workflow of ELISA assay. (p) ELISA assay was conducted to measure IFN-gamma and GZMB levels in CD8+ T cells following co-culture with TDM cells that had been treated with B. thetaiotaomicron or acetic acid. (n = 3). (q) ELISA assay was conducted to measure IFN-gamma and GZMB levels in CD8+ T cells following co-culture with BMDM cells that had been treated with B. thetaiotaomicron or acetic acid. (n = 3). (r) Flow cytometry was performed to assess cytotoxicity of T cells against tumor cells after co-culture with macrophages treated with B. thetaiotaomicron and acetic acid. (n = 3).
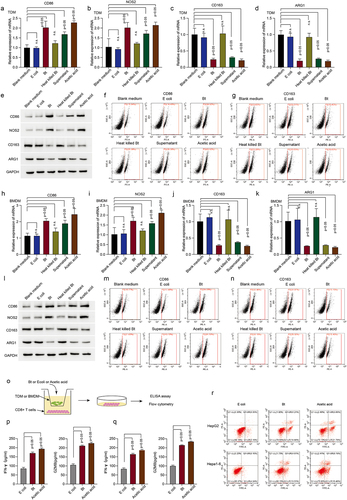
Figure 3. B. thetaiotaomicron-derived acetic acid participates in pro-inflammatory macrophages polarization in vivo. (a-c) tumor volumes (a-b) and tumor weights (c) were measured in mice bearing HCC cells treated with antibiotics, E coli, B. thetaiotaomicron or acetic acid. n = 6, nonparametric mann – Whitney test. (d) Immunofluorescence was performed to detect the expression of ki-67 in tumor models bearing HCC cells treated with antibiotics, E coli, B. thetaiotaomicron or acetic acid. (e) real-time PCR was performed to measure the mRNA expression of CD86, NOS2, CD163 and ARG1 in tumor models bearing HCC cells treated with antibiotics, ecoli, B. thetaiotaomicron or acetic acid. (n = 3). (f-g) flow cytometry was conducted to assess the levels of CD86 and CD163 in tumor models bearing HCC cells treated with antibiotics, E coli, B. thetaiotaomicron or acetic acid. (n = 3).
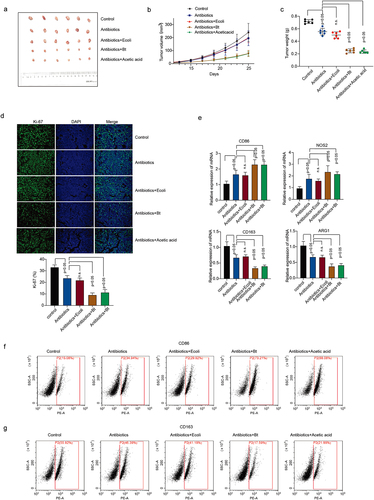
Figure 4. B. thetaiotaomicron-derived acetic acid might participate in M1 macrophage polarization via increasing the biosynthesis of fatty acid. (a) GSEA analysis was performed in HCC patients of cohort 1 with different level of B. thetaiotaomicron. (b) Correlation analysis was performed between ACSL1, ACC1 and FASN expression with B. thetaiotaomicron level in cohort 1. (c) The mRNA level level of ACSL1 was analyzed by real time PCR in BMDM after B. thetaiotaomicron and acetic acid treatment. (n = 3). (d) The protein level of ACSL1 was analyzed by Western blot in BMDM after B. thetaiotaomicron and acetic acid treatment. (n = 3). (e-f). The mRNA level (e) and protein level (f) of ACSL1, ACC1 and FASN was analyzed by real time PCR and Western blot in vivo after different treatment. (n = 3). (g) fatty acid production was evaluated in TDM-derived macrophage, BMDM and in HCC xenograft mouse model with different treatment. (n = 3). (h-i) the mRNA level (h) and protein level (i)of CD86, NOS2, CD163 and ARG1 was analyzed by real time PCR and Western blot in BMDM after different treatment. (j-k). The ELISA assay was performed to analyze the IFN-γ and GZMB level in CD8+ T cells after inoculated with TDM-derived macrophage (j) and BMDM (k) with different treatment. (n = 3). (l) Cytotoxic function of CD8+ T cells was evaluated in HCC cells after different treatment. (n = 3).
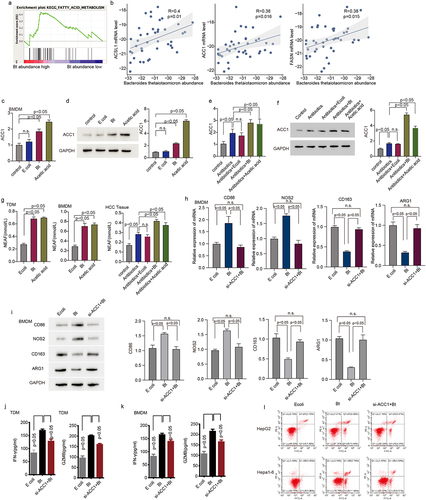
Figure 5. B. thetaiotaomicron-derived acetic acid facilitates the transcription of ACC1 by enhancing histone acetylation modification in the ACC1 promoter region. (a) Immunofluorescent assay was performed to analyzed the expression and location of GPR43 in TDM-derived macrophage and BMDM after E.Coli and B. thetaiotaomicron treatment. (b) The expression of GCN5 was analyzed in THP1-derived macrophage(TDM) and BMDM after B. thetaiotaomicron and acetic acid treatment. (n = 3).(c) Different modification of H3 histone was analyzed in TDM and BMDM after E.Coli and B. thetaiotaomicron treatment. (d) Acetylation level was analyzed at different site of H3 histone in TDM and BMDM after E.Coli and B. thetaiotaomicron treatment. (e) Western blot assay was performed to detect the level of H3K27ace in TDM and BMDM after different treatment. (f-g). The chip assay of H3K27ace at the promoter region of ACC1 was performed in TDM-derived macrophage (f) and BMDM (g)after B. thetaiotaomicron and acetic acid treatment. (n = 3). (h-i). The chip assay of H3K27ace at the promoter region of ACC1 was performed in TDM-derived macrophage (f) and BMDM (g) after different treatment. (n = 3). (j-k). The mRNA level of CD86, NOS2, CD163 and ARG1 was analyzed in TDM-derived macrophage (j) and BMDM (k) after different treatment. (n = 3). (l) The protein level of CD86, NOS2, CD163 and ARG1 was analyzed by Western blot in TDM-derived macrophage and BMDM after different treatment. (m) The ELISA assay was performed to analyze the IFN-γ and GZMB level in CD8+ T cells after inoculated with TDM-derived macrophage and BMDM with different treatment. (n = 3).
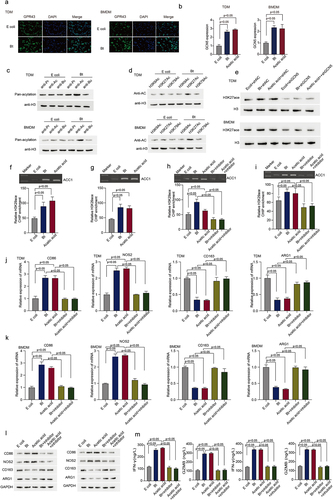
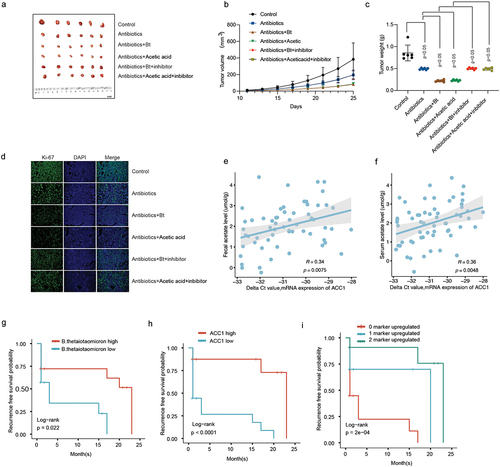
Figure 6. The inhibitory effect of B. thetaiotaomicron and acetic acid on the growth of HCC tumors and the prognostic significance of B. thetaiotaomicron abundance. (a) Representative image illustrating the inhibitory effect of B. thetaiotaomicron and acetic acid on HCC tumor growth in mice. (b) The inhibitory impact of B. thetaiotaomicron and acetic acid on HCC tumor volume. (c) The inhibitory effect of B. thetaiotaomicron and acetic acid on HCC tumor weight. (d) Representative image depicting the inhibitory effect of B. thetaiotaomicron and acetic acid on HCC through immunofluorescence in mice. (e) Correlation between the relative expression of ACC1 and the fecal acetate level(n = 60). (f) Correlation between the relative expression of ACC1 and the serum acetate level(n = 60). (g) Kaplan-meier curves showing the recurrence-free survival of patients with different abundance of B. thetaiotaomicron. (h) Kaplan-meier curves showing the recurrence-free survival of patients with different levels of ACC1. (i) kaplan-meier analysis of recurrence-free survival for HCC patients based on the number of upregulated molecular markers (B. thetaiotaomicron and ACC1) in cohort 2.