Figures & data
Figure 1. Gut microbial characteristics of different age groups. (A) Scatter plot of microbial species Shannon index for age. (B) Scatter plot of microbial pathways Shannon index for age. (C) UMAP plot of the microbial species using Bray–Curtis distance. (D) UMAP plot of the microbial pathways using Bray–Curtis distance.
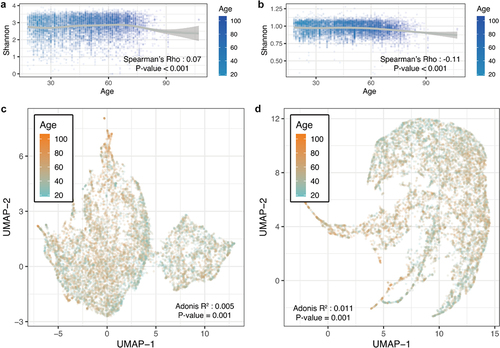
Figure 2. (A) barplot showing the relative abundance of the top 15 species for each age. (B) The correlation coefficient between the top 15 pathways and age.
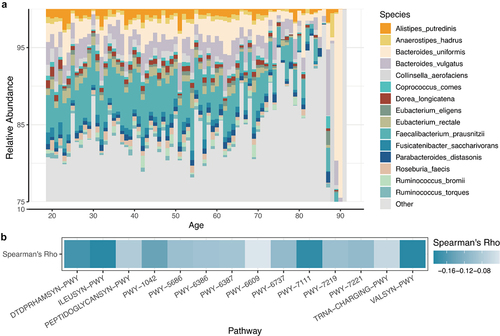
Figure 3. Performance evaluation of the ensemble model based on gut microbiome data (A) two heterogeneous models (linear and RF) were established to evaluate the c clustering and filtering. (B) Performance differences between integration strategies. (C) Ensemble model age prediction performance. (D) Impact of unpaired data on ensemble model performance.
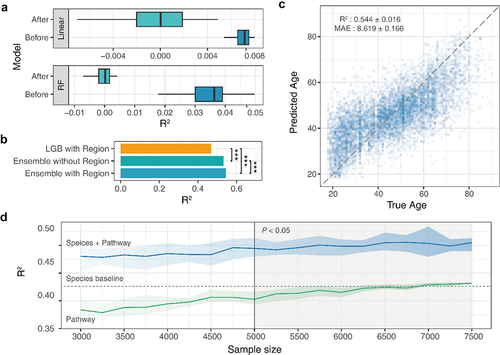
Figure 4. The top 20 age-specific markers. Beeswarm plot showed the distribution of accumulated local effect values under different marker abundance values.
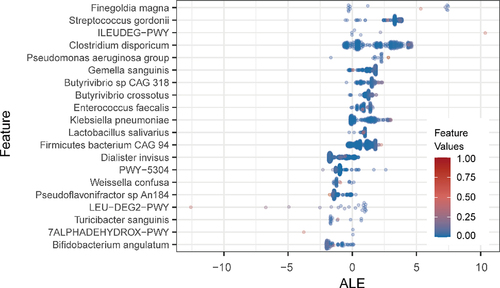
Figure 5. The gut aging clock reflected the health status of the host. (A) Box plot indicating the correlation between the number of diseases and chronological age. (B) Correlation between the number of diseases and predicted age. (C) Box plot indicating the significant differences in age-predicted residuals between disease states. NS: not significant, P >.05; *: P <.05; **: P <.01; ***: P <.001. The receiver operating characteristic (ROC) curves of the disease discrimination model constructed based on (D) species and (E) metabolic pathways. (F) Venn diagram indicated the degree of overlap between age-related and the diseases marker species. (G) Heatmap indicating the present condition of functional markers in the aging clock and diseases.
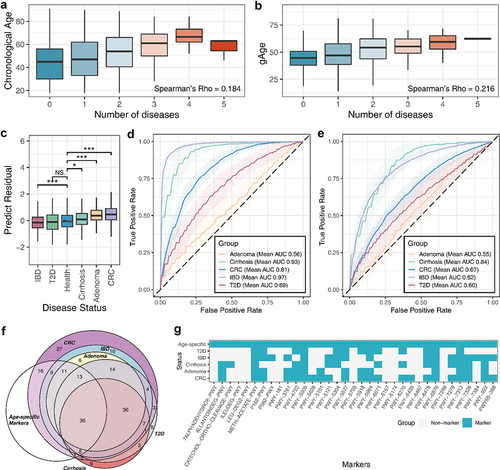
Figure 6. The gut aging clock reflected the frailty of the host. (A) Heatmap indicating the correlation of four frailty indices and two age types (functional independence measure, FIM; mini-mental state exam, MMSE; mini nutritional assessment, MNA). (B) The frailty correlation of the non-community population, including hospital days, rehabilitation (rehab), and long stay. (C) Box plot indicating the distribution trend of the prediction residuals and stratification in each age group. Only considered the age group with three or more different stratification categories. (D) The distribution characteristics of the prediction residuals and frailty scores of the cohort, and both indices obtained significantly high spearman’s correlation coefficient between the residuals and scores (P <.05). (E) True frailty score versus predicted score by various methods obtained microbiome markers. There was no significant difference between the prediction outcomes of the two source features (Wilcoxon P >.05).
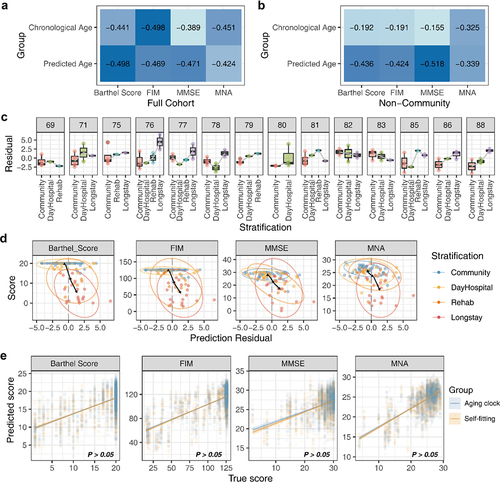
Figure 7. gAge assesses the degree of aging in the elderly population. Aging assessment based on gAge. (A) Correlation of different age characterization methods with aging scores. (B) Effect of different aging scores on gut microbiome. (C) Differences in species composition of different residual population. (D) Results of different aging evaluation methods. (E) Correlation between host background factors and indicators of frailty. (F) Aging marker identification based on cohort of elderly population.
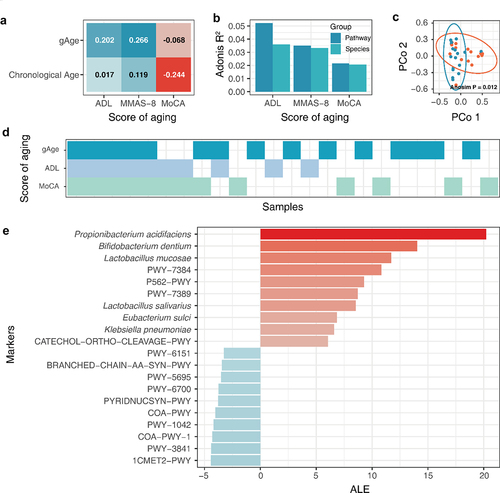
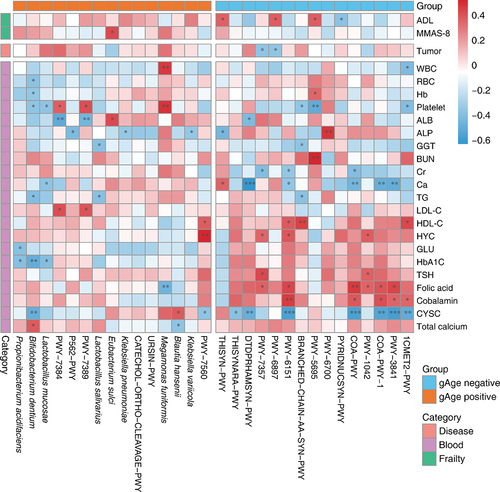
Figure 8. Analysis of correlation between markers of frailty and background factors in the elderly population.