
Figures & data
Figure 1. Percentage abundance of phyla present in gut according to age groups (A) males (B) females.
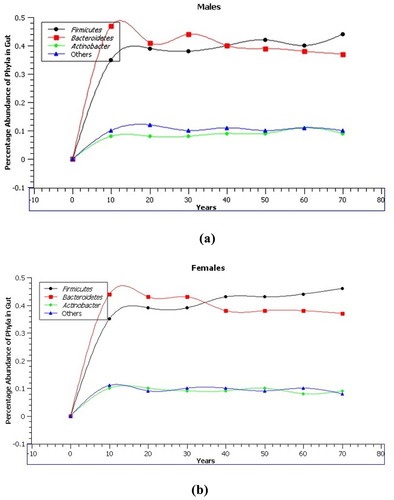
Figure 2. Different types of diet.
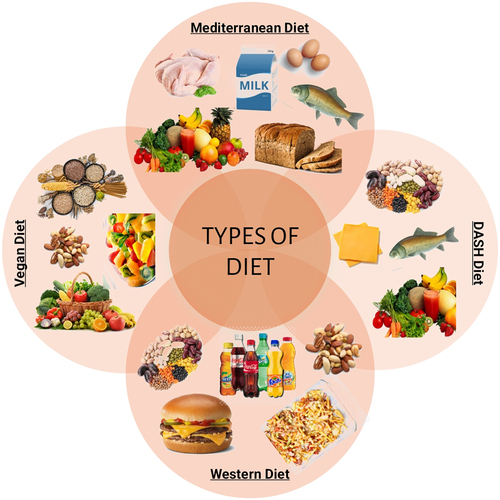
Figure 3. Role of gut microbiota in autoimmune diseases.
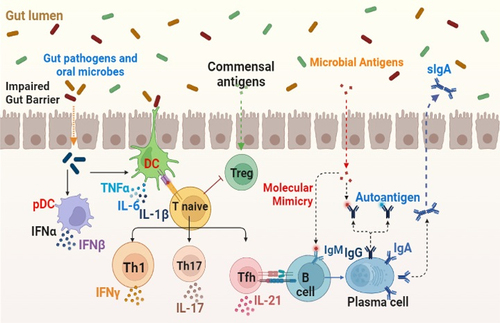
Figure 4. The human gut-brain axis.
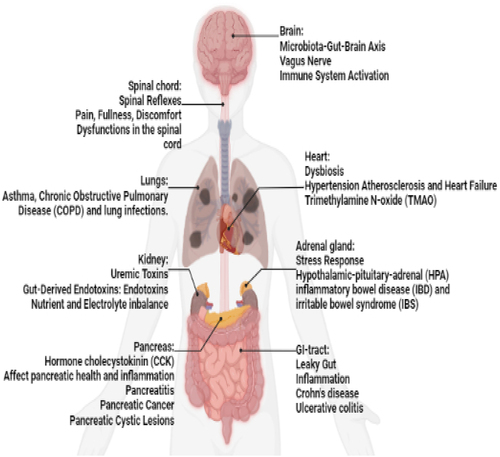
Figure 5. Metabolism of polyphenols by gut microbiota.
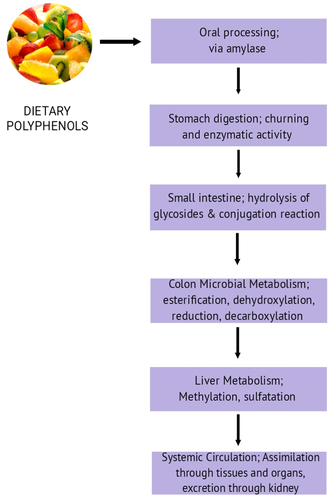
Table 1. Polyphenols, its natural sources and impact on microbiota.
Figure 6. Benefits of probiotics on the overall health of an individual.
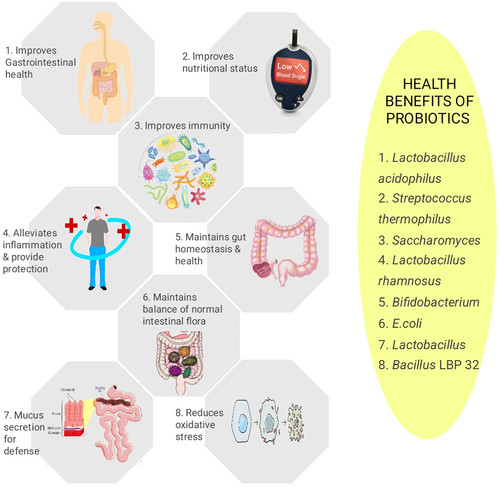
Table 2. Sources of non-dairy probiotics.
Figure 7. Mechanism of action of probiotics.
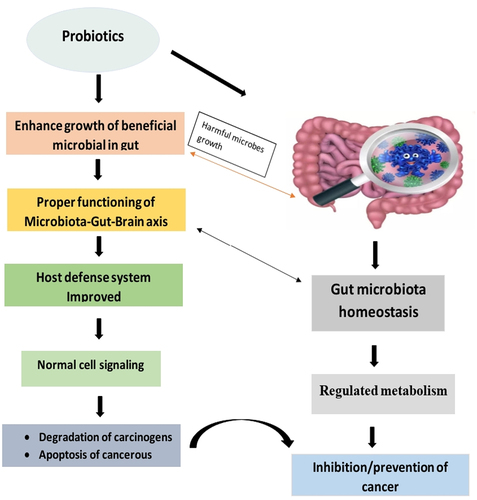
Figure 8. Cardiovascular health is linked with the diet which shapes the microbiota of the gut and leads to a healthy life cycle.
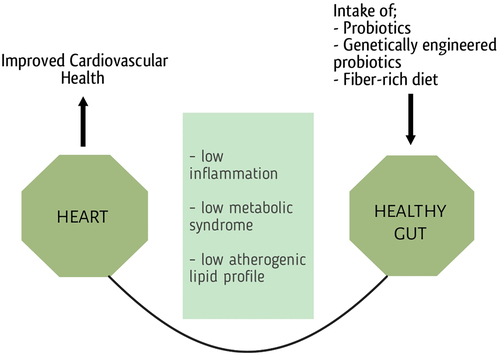
Table 3. Association of gut flora with various diseases.
Figure 9. Symptoms of aging with gut diseases.
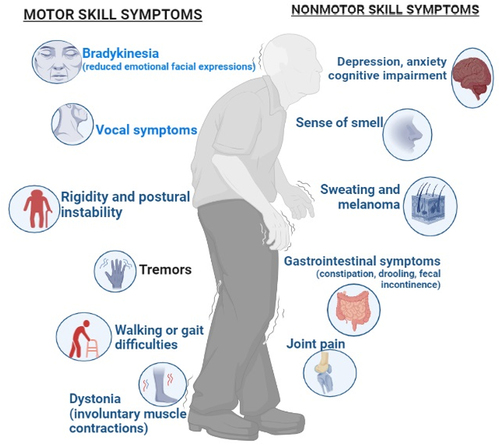
Figure 10. Gut health reduces the risk of various diseases.
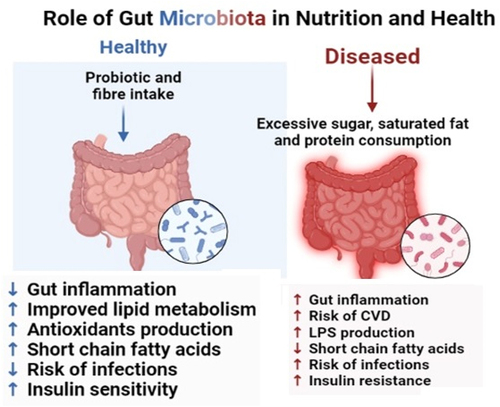
Table 4. Summary of the association between inflammatory diseases and gut microbiota concerning diet.