
Figures & data
Figure 1. Hyperbaric oxygen modulates intestinal type 3 immunity (a) experimental design illustrating murine treatment with 100% oxygen at 2.5 atmospheres (ATA) for 90 minutes daily over a 5-day period. (b) measurement of intestinal length in mice subjected to hyperbaric oxygen (HBO) treatment. N = 5. (c, d) dynamics of relative mRNA expression levels in percoll-purified colonic lamina propria (LP) lymphocytes at various time points post-HBO treatment. N = 5. (e, f) flow cytometry analysis depicting the percentage of live lin−CD45int CD90.2+RORγt+ ILC3 (e) and Ki67+ ILC3 (f) within the colonic LP. N = 5. (g) evaluation of the percentage of IL-17- and IL-22-producing ILC3 in the colon of HBO-treated mice. Cells were stimulated ex vivo with 10 ng/mL IL-1β and IL-23. N = 5. (h) quantitative polymerase chain reaction (qPCR) analysis illustrating the relative mRNA expression of IL-22-target genes in isolated colonic epithelial cells. N = 5. (i) hematocytometric analysis revealing the red blood cell number (left) and hemoglobin concentration (right) after HBO treatment. N = 5. (j, k) Spearman’s rank correlation coefficient illustrating the relationships between ILC3, IL-22, and rorc mRNA expression in the colon with red blood cell frequency (j) or hemoglobin content (k) in the bloodstream of HBO-treated mice at different time points. All data are representative of at least two independent experiments and are presented as mean ± SEM.
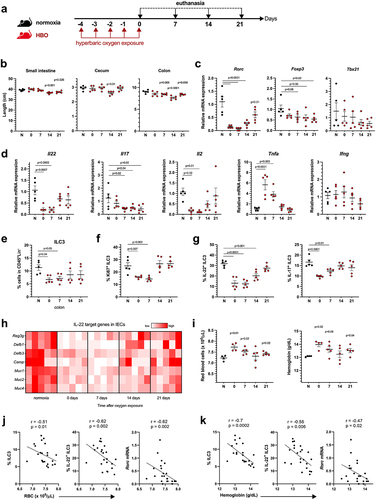
Figure 2. Hyperbaric oxygen modulates gut microbiota composition in mice. (a) experimental framework illustrating the hyperbaric oxygen (HBO) treatment regimen for subsequent analysis of the intestinal microbiome. Mice were subjected to hyperbaric 100% oxygen daily for 90 minutes over a 5-day period. (b) Principal coordinate analysis (PCoA) plot depicting Bray-Curtis dissimilarity index, distinguishing normoxic (green) and HBO-treated (orange) mice. N = 5. (c) taxonomy bar plots at the phylum level for normoxic and HBO-treated mice. N = 5. Individual plots can be referenced in fig. S2d. (d) linear discriminant analysis effect size (LEfSe) results, visually represented as an effect size (LDA score) bar plot, aiding in the identification of discriminative taxa between experimental groups. N = 5. (e) taxonomic bar plots at the genus level. N = 5. Individual plots are available in fig. S2e. (f) phylogenetic investigation of communities by reconstruction of unobserved states (PICRUSt2) analysis, predicting functional abundances based on marker gene sequences. N = 5. (g) experimental scheme detailing HBO treatment and subsequent C. difficile infection (CDI). N = 5. (h) evaluation of body weight variation (left) and clinical scores (right) for normoxic and HBO-treated mice post-CDI. N = 5. (i-k) assessment of colon length on day 7 post-infection (i), C. difficile colony-forming unit (CFU) counts on days 2 (left) and 5 (right) post-infection (j), and quantification of C. difficile toxins A and B in luminal contents on day 5 post-infection (k). N = 5. All data are presented as the mean ± SEM.
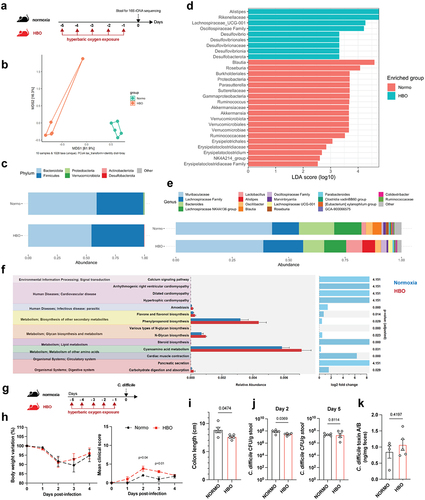
Figure 3. Increased susceptibility to C. difficile infection in HBO-exposed mice. (a) experimental design detailing the C. difficile infection (CDI) model with hyperbaric oxygen (HBO) treatment. Mice were subjected to a combination of antibiotics in drinking water for 4 days, followed by a single intraperitoneal dose of clindamycin. Subsequently, they were either infected or not with 10Citation8 CFU of C. difficile strain VPI 10,463. HBO sessions were conducted daily for 90 minutes during the 5 days preceding the infection (days −5 to − 1). (b) body weight variation (left) and clinical scores (right) recorded during CDI. N = 8, with antibiotics administered to uninfected groups, although they were not subjected to a C. difficile challenge. (c) assessment of colon length on day 4 post-infection. N = 4. (d) quantification of C. difficile colony-forming units (CFU) in the feces of normoxic or HBO-treated mice on days 2 (left) and 5 (right) post-infection. N = 3–5. (e) quantification of C. difficile toxin a and B luminal contents on day 5 post-infection. N = 5. (f) analysis of intestinal epithelial permeability through serum quantification of FITC-dextran after 4 hours of gavage. N = 4. (g) relative bacterial 16S rDNA quantification in mesenteric lymph nodes (mLN), liver, and spleen by qPCR on day 4 post-infection. N = 4. (h) absolute numbers of live CD45+CD11b+Ly6G+ neutrophils in the colonic lamina propria (LP) of uninfected and day 4 infected mice. N = 4. (i) quantification of inflammatory cytokines in the proximal colon by enzyme-linked immunosorbent assay (ELISA). N = 4. (j) absolute number of live lin- CD45intCD90.2+RORγt+ ILC3 in the colonic (left) and small intestine (right) LP of uninfected and 4 days post-infection mice. N = 3–4. (k) frequency of IL-22-producing ILC3 from normoxic or HBO-treated mice after ex vivo stimulation with IL-1β/IL-23 for 3 hours. N = 3. All results are representative of at least two independent experiments and are presented as the mean ± SEM.
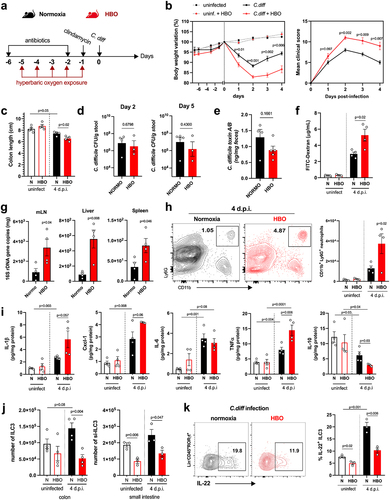
Figure 4. HBO potentiates antibiotic-associated dysbiosis and impairs intestinal SCFA levels. (a) experimental outline detailing the treatment of mice with oral antibiotics and concurrent hyperbaric oxygen (HBO) therapy before fecal 16S rDNA sequencing. (b) microbiome β-diversity analysis based on the Bray-Curtis dissimilarity ratio, represented by a principal coordinate analysis (PCoA) plot. N = 5. (c) bar plots depicting 16S rDNA gene reads assigned to taxonomy at the bacterial phylum level in fecal samples from normoxic or HBO-treated mice following antibiotic treatment. N = 5, with individual plots available in fig. S6d. (d) linear discriminant analysis effect size (LEfSe) results, visualized as an effect size (LDA score) bar plot, aiding in the identification of discriminative taxa between experimental groups. N = 5. (e) taxonomic bar plots at the genus level for normoxic and HBO-treated mouse fecal samples after antibiotic treatment. N = 5. Individual plots are detailed in fig. S6e. (f) prediction of metagenomic functional content using phylogenetic investigation of communities by Reconstruction of Unobserved States (PICRUSt2) based on marker gene sequences. N = 5. (g) experimental scheme illustrating antibiotic treatment and subsequent C. difficile infection (CDI) after HBO therapy. (h) quantification of luminal short-chain fatty acid (SCFA) levels by gas chromatography-mass spectrometry (GC-MS) in the proximal colon of HBO-infected mice. Sample size N = 4–5. GC-MS data are representative of at least two independent experiments and are presented as the mean ± SEM.
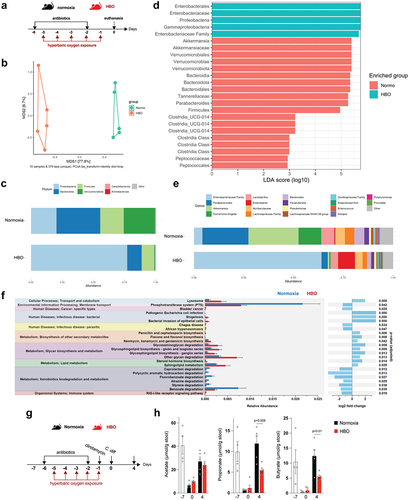
Figure 5. Butyrate supplementation alleviates CDI outcomes in HBO-Treated mice. (a) experimental design illustrating the combination of hyperbaric oxygen (HBO) therapy and oral butyrate treatment in the C. difficile infection (CDI) model. (b, c) body weight variation (b) and clinical scores (c) recorded during CDI. N = 8–9. (d) colon length on day 4 post-infection. N = 8–9. (e, f) quantitative histopathological score (e) and representative H&E-stained images of the colon (f) on day 4 post-infection. Scale bars = 100 µm. N = 5. Black arrow indicates epithelial cell necrosis; red arrow indicates goblet cells; red asterisk shows immune cell accumulation. (g) quantification of serum levels of FITC-dextran 4 hours after gavage on day 2 post-infection. N = 8–9. (h) relative bacterial 16S rDNA copies detected by qPCR in the mesenteric lymph nodes, liver, and spleen on day 4 post-infection. N = 8–9. (i) absolute numbers of live CD45+CD11b+Ly6G+ neutrophils in the colonic lamina propria at 4 days post-infection. N = 8. (j) inflammatory cytokine levels in the proximal colon on day 4 post-infection. N = 8. All results are derived from at least two independent experiments and are presented as the mean ± SEM.
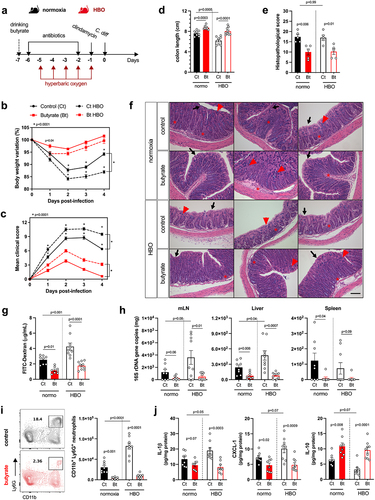
Figure 6. Butyrate enhances ILC3 responses and intestinal IL-22 signaling. (a) absolute numbers of live lin−CD45intCD90.2+RORγt+ ILC3 in the colonic (left) and small intestine (right) lamina propria on day 4 post-infection. N = 8–9. (b) percentage of IL-22, IL-17, and IFN-γ content in small intestine ILC3 from infected mice after ex vivo stimulation with IL-1β/IL-23. N = 6. (c, d) relative mRNA expression of antimicrobial peptides (c) and mucin (d) genes in isolated colonic epithelial cells on day 4 post-infection. N = 8. (e, f) analysis of mucus density by lectin-UEA-1 in situ hybridization in the proximal colon on day 4 post-infection. Blue = DAPI, red = lectin-UEA-1, and green = bacteria probe. Scale bars = 100 µm. N = 5. All results are representative of at least two independent experiments and presented as mean ± SEM.
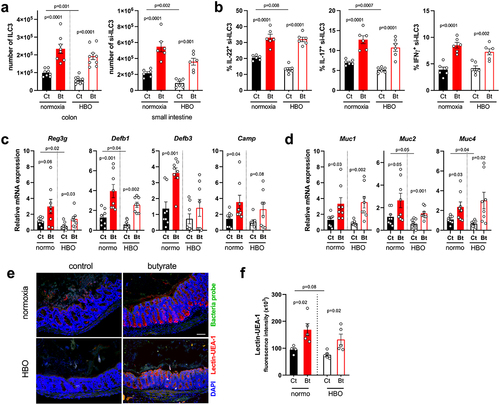
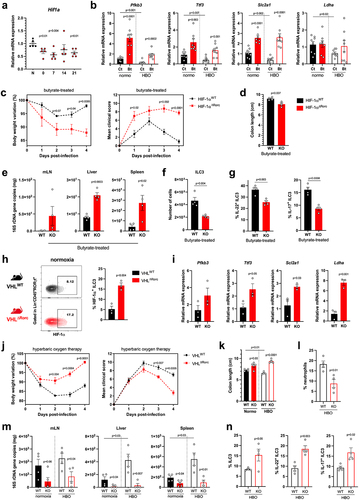
Figure 7. The efficacy of butyrate in conferring protection during CDI relies on the activation of HIF-1α in ILC3. (a) Relative Hif1a mRNA expression by percoll-purified lymphocytes from colonic lamina propria at different time points after hyperbaric oxygen (HBO). N = 5. (b) HIF-1 target genes mRNA expression by isolated lymphocytes from the colonic lamina propria on day 4 post-infection. N = 8. (c) body weight variation (left) and clinical scores (right) of butyrate-treated HIF-1 sufficient (HIF-1αWT) or conditional deficient (HIF-1αΔRorc) mice after HBO and CDI. N = 4. (d) colon length of butyrate-treated HIF-1αWT and HIF-1αΔRorc mice after HBO therapy on day 4 post-infection. N = 4–5. (e) relative 16S rDNA copies in the mesenteric lymph nodes, liver, and spleen of butyrate-treated HIF-1αWT and HIF-1αΔRorc mice after HBO on day 4 post-infection. N = 8–9. (f, g) absolute number of live lin−CD45intCD90.2+RORγt+ ILC3 (f) and its IL-22 and IL-17 content (g) in the colonic lamina propria 4 days post-infection of butyrate-treated HIF-1αWT and HIF-1αΔRorc mice after HBO. N = 4–5. (h, i) HIF-1α intracellular content in RORγt+ ILC3 (h) and its relative target gene mRNA expression in isolated colonic lymphocytes (i) from VHLWT and VHLΔRorc mice at steady-state. N = 3. (j) body weight variation (left) and clinical scores (right) of infected VHLWT and VHLΔRorc mice after HBO. N = 4. (k-m) colon length (k), absolute number of live CD45+CD11b+Ly6G+ neutrophils in colonic lamina propria (l), and relative bacterial 16S rDNA quantification (m) on day 4 post-infection in HBO-treated VHLWT and VHLΔRorc mice. N = 4. (n) percentage of colonic RORγt+ ILC3 (left) and ex vivo production of IL-22 and IL-17 (right) from HBO-treated VHLWT and VHLΔRorc mice. N = 4. All mice were littermates and matched by age/sex. Results are representative of at least two independent experiments and presented as mean ± SEM.
Supplemental Material
Download Zip (19.8 MB)Data availability statement
All the relevant data supporting these findings are available in this report. In particular, 16S sequencing data have been deposited in the NCBI BioProject: PRJNA900580.