
Figures & data
Figure 1. Effects of pasteurized A. muciniphila on colonic hypersensitivity induced in a non-inflammatory IBS mouse model. The sNMS mice that underwent a neonatal maternal separation paradigm and developed a colonic hypersensitivity, were treated for 10 days by gavage with a vehicle (sNms/veh) or with two different doses (3×10⁹ TFU for the sNMS/1 group or 6 × 10⁸ TFU for the sNMS/5 group) of pasteurized A. muciniphila (pAkk) (n = 10 males and n = 10 females per group). (a) Intracolonic pressure variation in response to a colorectal distension in male sNMS mice. (b) Intracolonic pressure variation in response to a colorectal distension in female sNMS mice. (c) Total area under the curve (AUC) for both male and female sNMS mice. Data are from two independent experiments. *p < 0,05; **p < 0.01; ***p < 0.001 sNms/veh vs. sNMS/1.
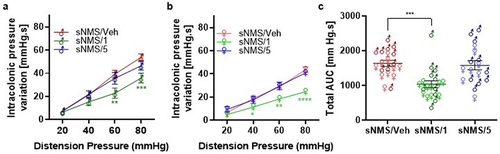
Figure 2. Effects of pasteurized A. muciniphila on intestinal permeability in a non-inflammatory IBS mouse model. The sNMS mice that underwent a neonatal maternal separation paradigm and have developed a colonic hypersensitivity, were treated for 10 days by gavage with a vehicle (sNms/veh) or with two different doses (3×10⁹ TFU for the sNMS/1 group or 6 × 10⁸ TFU for the sNMS/5 group) of pasteurized A. muciniphila (pAkk). (a) Intestinal permeability assessed by measuring 4 kDa FITC-Dextran concentration in serum, 3.5 hours after its administration by gavage. The percentage of intestinal permeability was calculated by doing the ratio between plasma FITC levels after treatment and before vehicle or pasteurized A. muciniphila treatment for each mouse (n = 10 males and n = 10 females per group). (b-d) colonic expression of (b) ZO-1, (c) Occludin and (d) claudin-2 mRNA in each mouse group was quantified by RT-qPCR. Data are from two independent experiments. ***p < 0.001; ****p < 0.0001.
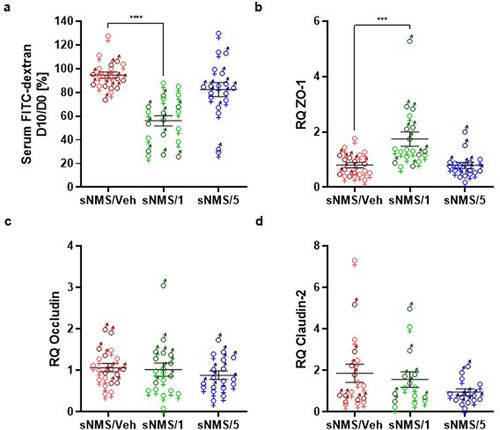
Figure 3. Effects of pasteurized A. muciniphila on colonic hypersensitivity induced in a post-infectious IBS mouse model. Mice were infected with citrobacter rodentium to induce a PI-IBS mouse model. The non-infected mice were inoculated with 200 µL of sterile PBS. During the post-infectious phase, mice were treated by gavage for 8 days from 16 days post infection (DPI) to 23 DPI. Non-infected (Ni/veh) and infected (Citro/Veh) mice were forced fed with the vehicle. Non-infected mice from the NI/1 group were forced-fed with 3 × 10⁹ TFU of pasteurized A. muciniphila (pAkk). Mice from the Citro/1 and Citro/5 group were forced-fed with 3 × 10⁹ TFU or 6 × 10⁸ TFU of pasteurized A. muciniphila. (a) Post-infectious colonic sensitivity assessed by measuring intracolonic pressure variations in response to a colorectal distension and (b) corresponding total area under the curve (AUC) (n = 10–34 per group). Data are from three independent experiments. * : Citro/Veh vs. NI/Veh. $ : Citro/Veh vs. Citro/1. # : Citro/Veh vs. Citro/5.
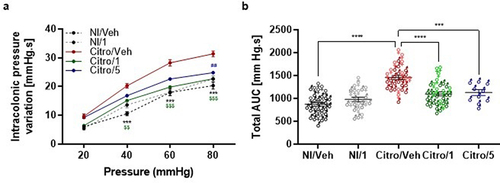
Figure 4. Effects of pasteurized A. muciniphila on intestinal tight junction protein expression in a post-infectious IBS mouse model. Mice were infected with citrobacter rodentium to induce a PI-IBS mouse model. The non-infected mice were inoculated with 200 µL of sterile PBS. During the post-infectious phase, mice were treated by gavage for 8 days from 16 days post infection (DPI) to 23 DPI. Non-infected (Ni/veh) and infected (Citro/Veh) mice were forced-fed with the vehicle. Non-infected mice from the NI/1 group were forced-fed with the highest dose (3×10⁹ TFU) of pasteurized A. muciniphila (pAkk). Mice from the Citro/1 and Citro/5 group were forced-fed with the highest dose (3×10⁹ TFU) or the lowest dose (6×10⁸ TFU) of pasteurized A. muciniphila. Colonic expression of (a) ZO-1, (b) Occludin and (c) claudin-2 mRNA in each mouse group (n = 9–20 per group) was quantified by RT-qPCR. Data are from two independent experiments. *p < 0.05; **p < 0.01; ****p < 0.0001.
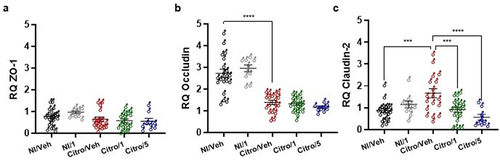
Figure 5. Pasteurized A. muciniphila treatment reverses post-infectious anxiety- and cognition-like behavior induced by C. rodentium infection. After a treatment with pasteurized A. muciniphila (pAkk), anxiety-related behavior induced by a C. rodentium post-infection were determined by EPM test at 21 days post-infection (DPI) and by the hole-board test at 22 DPI (n = 12 per group). (a) Number of entries and (b) time spent in open arms (monitoring for 5 minutes) during the EPM test. (c) Number of head dips made on the hole-board during 5 minutes were quantified (n = 10–12 per group). Cognition-related behaviors analyses were performed using (d) the Y-maze test in which spontaneous alternation were measured for 10 minutes and (e-f) time spent exploring the novel object and the relocated object during novel object and relocation tests, respectively. Data are from two independent experiments. *p < 0.05; **p < 0.01; ***p < 0.001; ****p < 0.0001.
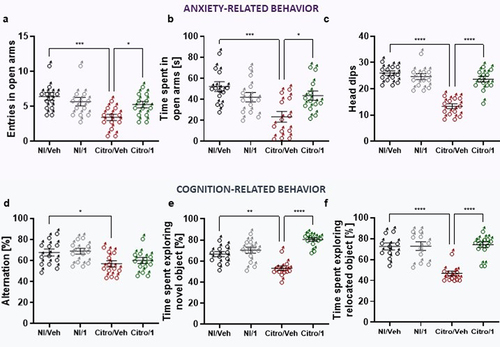
Figure 6. Impact of pasteurized A. muciniphila on fecal microbiota composition and colonic IL-22 expression in IBS-like models. (A and B) fecal microbiota composition was determined using 16S rRNA amplicon sequencing (V4 regions) (n = 10–12 per group), and principal coordinates analysis (PCoA) with a Bray-Curtis distance metric of the different mouse groups are shown for the NMS paradigm (a) and the C. rodentium infection (b) IBS-like mouse models. Ellipses represent the 95% confidence interval and the first and second components of the variance are shown in percentages. (e-e) colonic IL-22 expression (relative to 26S expression) in non-infected mice with or without 3 × 10⁹ TFU pasteurized A. muciniphila (pAkk) treatment (c), in C. rodentium infected mice with or without 3 × 10⁹ TFU pAkk treatment (d), and in sensitized NMS mice with or without 3 × 10⁹TFU pAkk treatment (e). *p < 0,05; veh treatment vs. pAkk treatment.
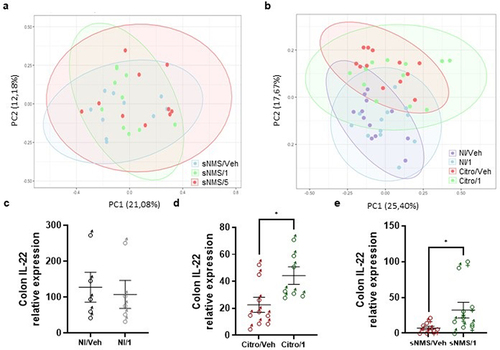
Figure 7. Neuromodulatory potential of pasteurized A. muciniphila on nociceptors from dorsal root ganglia innervating the colon. (a-b) neurons from all murine DRGs were activated with a pan-neuronal stimulation with KCl 30 mM. The percentage of neurons responding to the two KCl 30 mM simulations (a) and their activation level after the second KCl 30 mM stimulation (b) has been evaluated. (c-l) nociceptors (Nav1.8-cre-TdTomato positive neurons) from murine DRG innervating the colon were activated with several algogenic substances such as (c-d) capsaicin, (e-f) inflammatory soup, (G-H) serotonin 15 µM, (i-j) bradykinin 5 µM, or (k-l) histamine 15 µM. A ratiometric calcium imaging was used to visualize in real-time the neuronal activation level before and after incubation of pasteurized A. muciniphila (pAkk) or its vehicle. For the data analysis, the kinetic stimulation was studied for each viable neuronal cell. The percentage of neurons responding to each algogenic substances and the fold change in response intensity to the second stimulation (after vehicle or pasteurized A. muciniphila incubation) relative to the response intensity to the first stimulation of all viable neuronal cells belonging were calculated. Data are from two or three independent experiments. ****p < 0.0001.
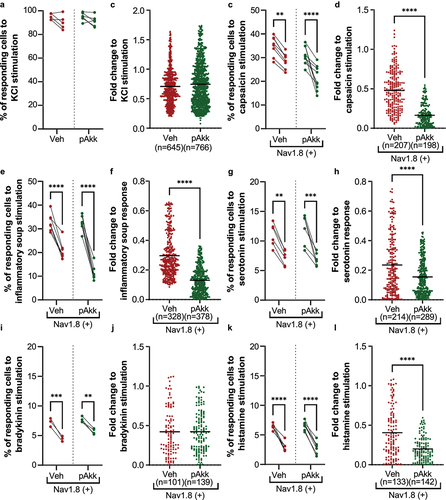
Figure 8. Experimental procedure of in vitro evaluation of the neuromodulatory properties of pasteurized A. muciniphila. Evaluation of neuronal cell activation by ratiometric calcium imaging on mouse DRG neurons.
Supplemental Material
Download MS Word (13.8 KB)Data availability statement
The raw amplicon sequencing data analyzed in this study have been deposited in the EMBL-EBI European Nucleotide Archive (ENA) under accession number PRJEB53668 (https://www.ebi.ac.uk/ena/browser/view/PRJEB68376). The authors confirm that the data supporting the findings of this study are available within the article and its supplementary materials.