
Figures & data
Table 1. Characteristics of the non-constipated IBS patients considered in this study. Mean values ± standard deviation for each parameter are reported.
Figure 1. Study scheme (a) and summary of the IBS patients that concluded the PROBE-IBS/2 trial per protocol (PP) in the probiotic arm included in this study (b). NRS, numeric rating scale.
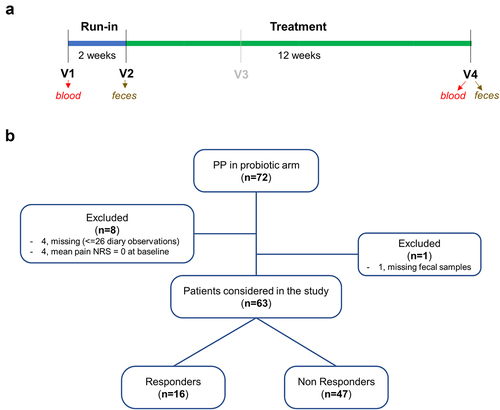
Figure 2. Fecal bacterial taxa distinguishing responder (R) from non-responder (NR) non-constipated IBS patients. P values, derived from Mann-Whitney tests on CLR-transformed bacterial abundances, are color-coded with red indicating taxa increased in the R group. The heatmap displays mean CLR-transformed abundances of reported taxonomic units. Taxonomic lineage is denoted: p, phylum; c, class; o, order; f, family; g, genus; s, species. Corrections to GreenGenes database nomenclature, based on NCBI Taxonomy, are shown in violet. Taxonomic names in blue were determined via manual BLASTN search in GenBank using corresponding read sequences. The histogram on the right illustrates the contribution of each bacterial taxon to the first two components of the PLSDA biplot in , with Roman numerals linking taxa to the PLSDA loading plot. Bold text highlights the 11 bacterial taxa significantly contributing to variability in the PLSDA analysis.
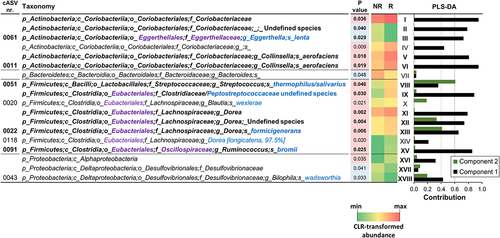
Figure 3. Biplot of PLS discriminant analysis (PLSDA) with prediction background for responder (R) and non-responder (NR) non-constipated IBS patients (panel a) and for R, NR, and healthy controls (HC) (panel b). Roman numerals in panel a refer to bacterial taxa in figure 2. The percentages indicate the explained variation at each axis. The Receiver Operating Characteristic (ROC) curves of the PLSDA model are shown in supplementary Figure S1.
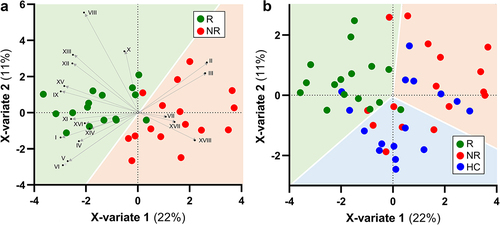
Figure 4. Dot plot of the most abundant bacterial taxa found to better discriminate between responders and non-responder patients in the PROBE-IBS/2 trial. HC, healthy controls (n = 100); R and NR, responder and non-responder NC-IBS patients in the PROBE-IBS/2 trial, respectively; other NC-IBS, other non-constipated IBS patients recruited at baseline during the PROBE-IBS/2 trial (n = 161); statistics is according to Mann-Whitney test; *, P < .05; **, P < .01.
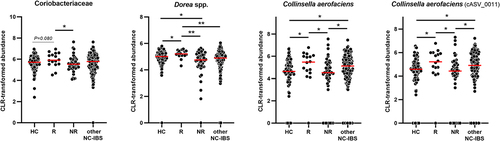
Figure 5. Linear discriminant analysis (LDA) effect size (LEfSe) graphics for responders (R) NC-IBS patients in the probiotic arm. LDA scores indicate taxa significantly (P < 0.05) higher before (V2; negative LDA) or after (V4; positive LDA) probiotic intake. Taxon levels are abbreviated: p, phylum; c, class; o, order; f, family; g, genus; and s, species. Corrections/updates to GreenGenes database nomenclature are marked in violet, while taxonomic names determined through a manual BLASTN search in GenBank using corresponding read sequences are highlighted in blue. Taxon cAVS 254 is identified as the administered probiotic strain (L. paracasei DG; highlighted in green).
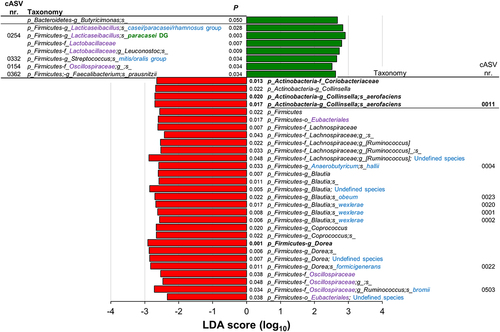
Figure 6. Analysis of data collected during the PROBE-IBS/1 cross-over trial. (a) fecal abundance of the bacterial species collinsella aerofaciens in IBS patients before and after the intake of the probiotic product. IBS-CU, constipated and undefined IBS patients; IBS-DM, diarrhea or mixed IBS patients. Statistics is according to Wilcoxon signed-rank test; *, P < .05; n.S., nonsignificant (P > .05). (b) fecal abundance of C. aerofaciens (on the left) and abdominal pain/discomfort (on the right) in IBS-DM patients during the PROBE-IBS/1 trial. NRS, numeric rating scale used to measure abdominal pain/discomfort. Statistics is according to non-parametric repeated measure ANOVA-Type statistic (RM-ATS). The reported P values indicate significant Time×Treatment interaction. **, P < .01; *, P < .05.
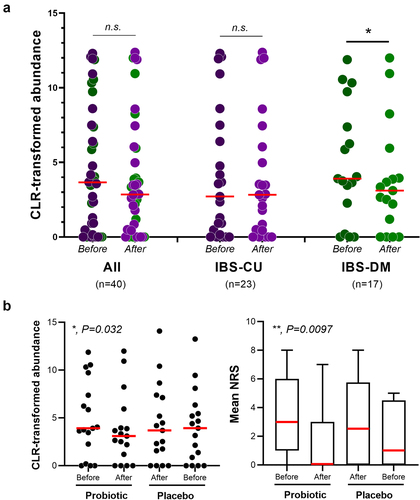
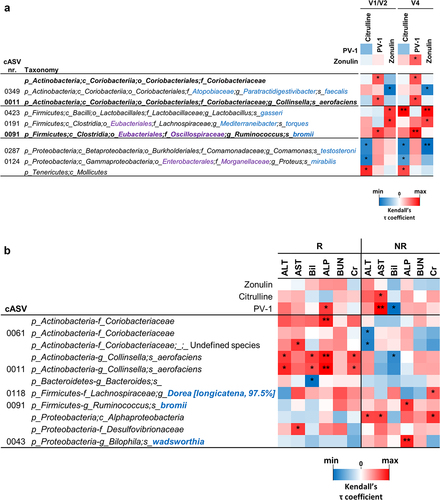
Figure 7. Correlation analyses between bacterial taxa and serum markers for permeability (panel a) and liver and kidney functionality (panel b). In panel a, correlation analyses were conducted with data from blood samples collected before run-in (visit V1) and fecal samples collected before the probiotic intervention (visit V2), as well as with data from blood and fecal samples collected at the end of the probiotic intervention (visit V4) denoted as V1/V2 and V4, respectively. Only taxa exhibiting consistent significant correlations at both V1/V2 and V4 are displayed. The heatmap represents the τ coefficient of Kendall rank correlation (*, P < .05; **, P < .01; ***, P < .001). Taxonomic lineage is indicated as follows: p, phylum; c, class; o, order; f, family; g, genus; s, species. Corrections/updates to GreenGenes database nomenclature are highlighted in violet, and taxonomic names determined through a manual BLASTN search are in blue. ALT, alanine aminotransferase; AST, aspartate-aminotransferase; Bil, bilirubin; ALP, alkaline phosphatase; BUN, blood urea nitrogen; cr, creatinine.
Data supplement file_Guglielmetti_R1_CLEAN.docx
Download MS Word (709.3 KB)Data availability statement
Metataxonomic raw sequencing data are available as FASTQ files in the European Nucleotide Archive (ENA) of the European Bioinformatics Institute under the accession code PRJEB56302. Metataxonomic raw sequencing data related to PROBE-IBS/120 are under accession code PRJEB18753. Processed data are included in the article or uploaded as supplementary materials. All the other data are available upon request.