
Figures & data
Table 1. Child cohort demographics and neurodevelopmental outcome metrics.
Figure 1. Partial Pearson correlation of neurodevelopmental outcome metrics for a cohort of Black children living in low socioeconomic and high stress environments (average age 7.6 months old; n = 28), after adjustment for gestational age at birth, birthweight, age at assessment visit and sex. Metrics are ordered by hierarchical clustering via the ward linkage method, and optimal clusters are enclosed in rectangles as chosen by the permutation around medoids (i.e., k-medoids) clustering solution with the largest average silhouette width. Significant correlations are indicated as follows: ***p < .001; **p < .01; *p < .05.
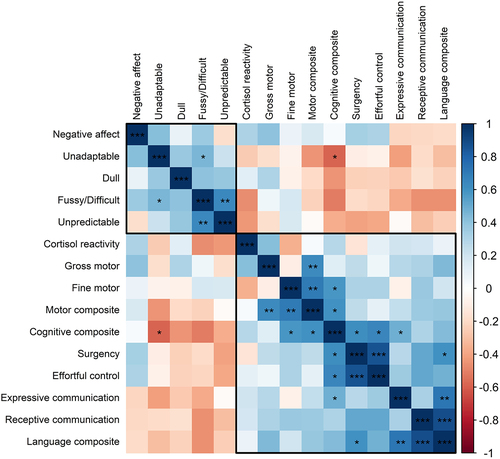
Figure 2. Overall α-diversity and β-diversity of the fecal microbiome (n = 28) in relation to the neurodevelopmental outcome metrics. (a) Two community types were determined to be present in the child (average age 7.6 months old) fecal microbiome dataset through the probabilistic method of dirichlet multinomial mixtures. These community types could be described at the taxonomic levels of family and genus, and top microbial genera driving the differential composition of these community types are indicated. Statistically significant Kyoto Encyclopedia of Genes and Genomes (KEGG) metabolic pathways differentiating the two community types from gene-set enrichment analysis of the t-scores produced from linear modeling are also displayed by the absolute value of their normalized enrichment scores (NES) and relative significance. ***p < .0001; **p < .001; *p < 0.01. (b) Overall α-diversity (i.e., richness) and β-diversity (i.e., community type) were significantly associated with the Bayley Scales of Infant Development III cognitive and language composite scores in a sex-dependent manner. Significance (p < .05) was determined through multiple regression after adjusting for gestational age at birth, birthweight, and age at assessment visit. Interaction plots of the standardized variables after modeling demonstrate the sex-dependent relationship of richness and these neurodevelopmental outcomes. Estimated marginal means (emmean) with 95% confidence intervals from the standardized variables after modeling demonstrate the sex-dependent relationship of community type and these neurodevelopmental outcomes.
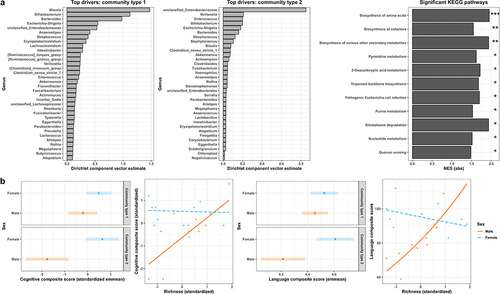
Table 2. Kyoto Encyclopedia of Genes and Genomes (KEGG) metabolic pathways and modules of the fecal microbiome that were most significantly positively and negatively associated with each neurodevelopmental outcome metric.
Figure 3. Differential Kyoto Encyclopedia of Genes and Genomes (KEGG) metabolic pathways or modules of the fecal microbiome associated with child (average age 7.6 months old; n = 28) neurodevelopmental outcome metrics by sex after gene-set enrichment analysis of t-scores generated from multiple regression models that adjusted for gestational age at birth, birthweight, and age at assessment visit. Estimated marginal means (emmean) for a representative KEGG orthology from each of these pathways/modules are displayed for each sex, with magnitude indicated by the size of circle and direction indicated by the color (yellow = positive association; purple = negative association). Significance (p < .05; false-positive rate < 1%) is indicated from either the model regression term (red colored circle border) or sex interaction (green colored circle border).
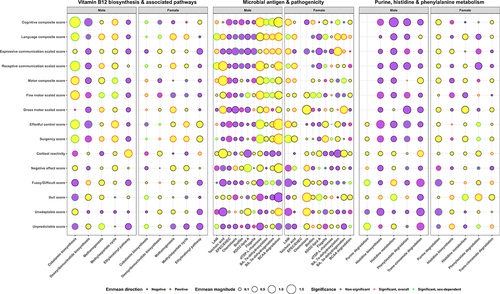
Table 3. Microbial taxa contributing to the fecal microbiome Kyoto Encyclopedia of Genes and Genomes (KEGG) metabolic pathways/modules significantly associated with the neurodevelopmental domains.
Figure 4. The significant (p < 0.05) estimated marginal linear trends (emtrend) between fecal bile acid content and the Bayley Scales of Infant Development III cognitive composite score by sex in a cohort of Black children living in low socioeconomic and high stress environments (average age 7.6 months old; n = 28), after adjustment for gestational age at birth, birthweight, and age at assessment visit.
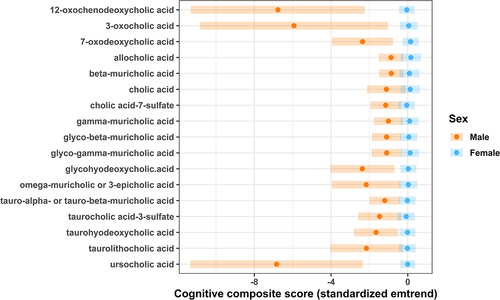
Table S3.xlsx
Download MS Excel (18.6 KB)Table S11.xlsx
Download MS Excel (30.5 KB)Table S5.xlsx
Download MS Excel (80.4 KB)Table S10.xlsx
Download MS Excel (83.3 KB)Table S12.xlsx
Download MS Excel (1.2 MB)Table S2.xlsx
Download MS Excel (27.4 KB)Table S1.xlsx
Download MS Excel (8.9 KB)Table S9.xlsx
Download MS Excel (135.8 KB)Table S7.xlsx
Download MS Excel (1.7 MB)Table S4.xlsx
Download MS Excel (29.9 KB)Table S6.xlsx
Download MS Excel (72.7 KB)Table S8.xlsx
Download MS Excel (1.3 MB)Data availability statement
The data that support the findings of this study are openly available in NCBI SRA at http://www.ncbi.nlm.nih.gov/bioproject/895372, reference number PRJNA895372, in addition to the provided supplementary tables.