
Figures & data
Figure 1. Increased levels of immunosuppressive markers in the PBMCs of AGC patients.
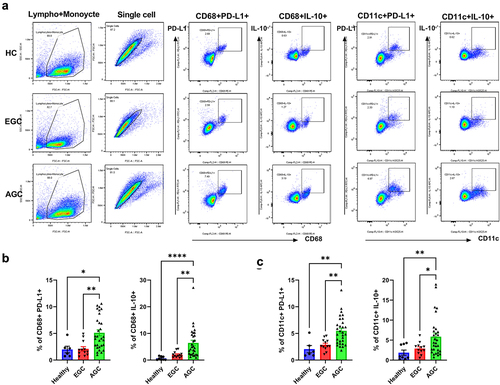
Figure 2. Increased levels of immunosuppressive markers in the tumor mucosa of AGC patients.
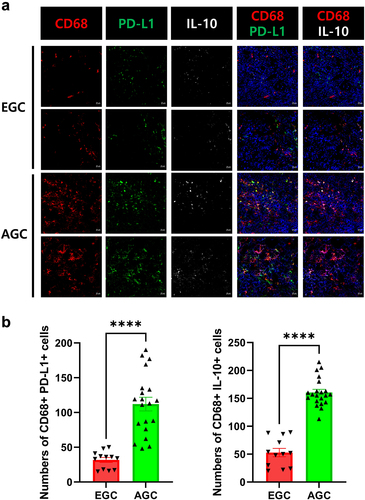
Table 1. Clinicopathological characteristics of the patients with early gastric cancer and advanced gastric cancer.
Figure 3. Gut microbiota profile of patients with GC.
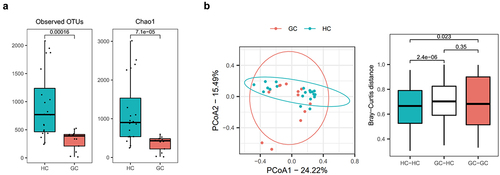
Figure 4. Differential microbial abundance in GC patients.
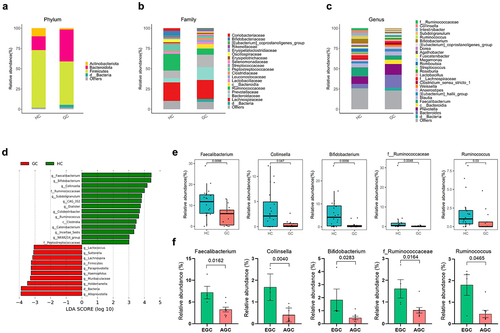
Figure 5. Reduction of PD-L1 and IL-10 levels by butyrate.
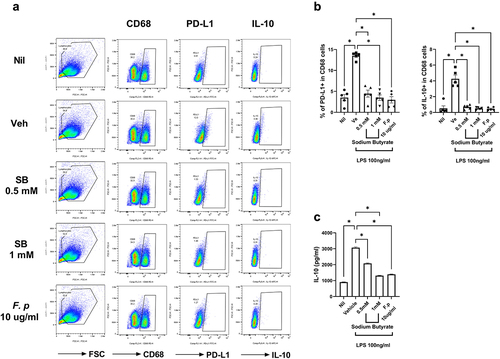
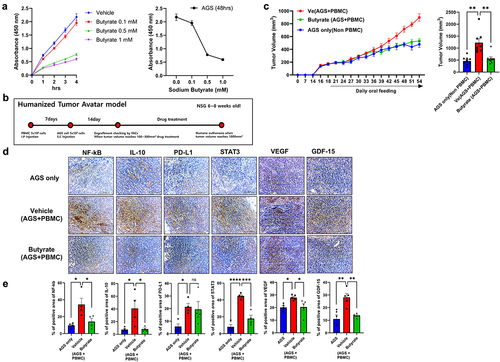
Figure 6. Inhibition of tumor cell growth by butyrate.
Lee et al_Supplementary Information clean.docx
Download MS Word (543.8 KB)Data availability statement
The authors confirm that the data supporting the findings of this study are available within the article. Gut microbiome analysis was deposited in the BioProject and Sequence Read Archive (SRA; https://www.ncbi.nlm.nih.gov/sra) under the accession numbers PRJNA937852.