
Figures & data
Figure 1. High-affinity anti-LMW mAbs bind distinct epitopes a. Schematic view of immunization, hybridoma generation and screening for obtention of anti-LMW mAbs. b. Mab binding to recombinant LMW measured by ELISA at indicated concentrations. Dark curve represents isotype control. c. Affinities toward LMW determined by Bio-Layer Interferometry. Representative sensorgrams of one low (4G4) and one high-affinity (2B7) mAb. Antibody concentration from 500 nM to 8 nM for 4G4 and from 2 nM to 0.02 nM for 2B7 were tested, as shown from top to bottom. Blue curves represent raw data while red curves represent fitting with a 1:1 antibody:antigen model. d. Summary table representing the results of BLI-based competitive of anti-LMW mAbs toward LMW.
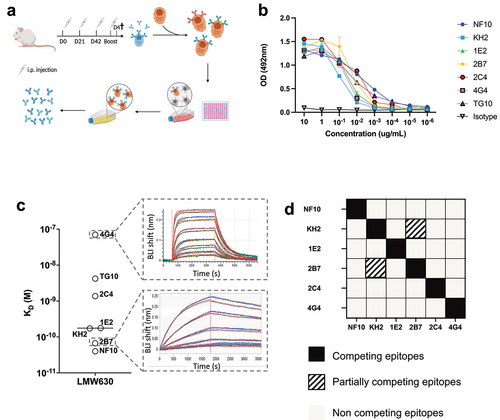
Figure 2. Anti-LMW mAbs bind vegetative C. difficile cells and enhance phagocytosis. a-b. Flow cytometry analysis of mAbs binding to indicated C. difficile reference strain 630 (a)and other Clostridium species or C. difficile strain (CD20–247 R012) (b). Black curve corresponds to isotype control. c. Representative view of mAb binding to C. difficile vegetative cells but not to spores. DNA from vegetative cells and spores was labeled with SYTO9 while mAb-coated bacteria were stained with AF647-conjugated anti-mouse IgG antibody. Merged staining was presented on the right panel. Analysis was performed by confocal microscopy. d. Percentage of neutrophils that have phagocytosed C. difficile-opsonized by the indicated mAb after 60 min and assessed by flow cytometry. Data represent mean + SEM of n = 3 technical replicates. Experiment was performed with at least two biological replicates. Asterisks indicate statistical significance with a two-way ANOVA test (ns: not significant; *p <.05, **p <.01, *** p <.001, and ****p <.0001).
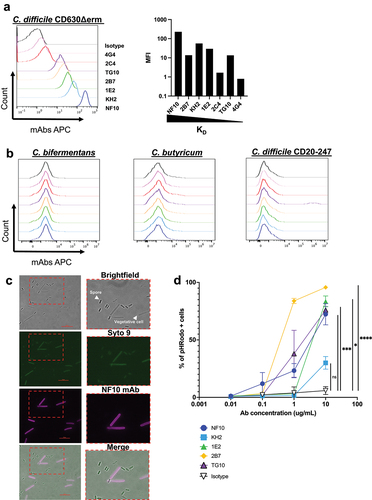
Figure 3. Effect on growth of anti-LMW mAbs and sensitivity to lysozyme and DCA. Cultures of C. difficile 630Δerm were inoculated at an OD600 nm of 0.05 and grown anaerobically at 37°C with OD600 nm measurements every 30 min. a. Effect of anti-LMW mAbs was assessed on growth. Left panel represents growth curves until 18 h with measurements every 30 min for all anti-LMW mAbs and isotype. Right panel represents quantitative analysis at 13 h for all anti-LMW mAbs and isotype. b. Effect of NF10 mAb was assessed on C. difficile UK1 strain growth at different concentrations. Data are presented as means and standard deviations from three technical replicates. c. LDH activity in the supernatant was normalized to condition without antibodies. The interquartile boxplots show medians (middle line), and the whiskers indicate minimal and maximal values. Asterisks indicate statistical significance calculated with a one-way ANOVA test followed by a Dunnett’s multiple comparison test (****p <.0001). Experiments were performed with two biological replicates in six technical replicates. d. Cultures of C. difficile 630Δerm incubated with different concentrations of NF10 mAb were monitored in combination with lysozyme (500 μg/ml), which was added after 2.5 h growth or DCA (240 µM). Isotype control (dark lines) was included in all experiments. Data are presented as mean values (±SD) from three technical replicates. Asterisks indicate statistical significance with a two-way ANOVA test (ns: not significant; *p <.05, **p <.01, *** p <.001, and ****p <.0001).
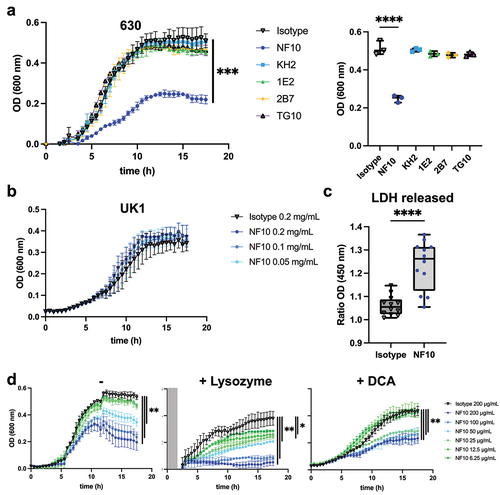
Figure 4. Anti-LMW mAbs modulate C. difficile toxin secretion. Quantification of TcdA or TcdB toxin secretion in CD630Δerm in the presence of anti-LMW mAbs or isotype control. CD630ΔermΔPaloc mutant strain has been tested as a negative control. Toxin titers in culture supernatants were determined at 24 h and 48 h by ELISA. Boxplots show medians (middle line) and interquartile range, and the whiskers indicate minimal and maximal values of three replicates. Asterisks indicate statistical significance calculated with a one-way ANOVA test followed by a Dunnett’s multiple comparison test (ns: not significant; *p <.05, * p <.01, ***p <.001, and ****p <.0001).
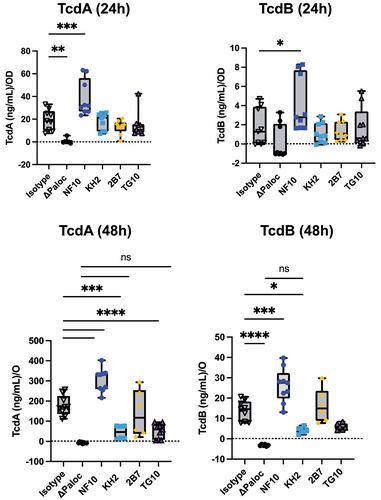
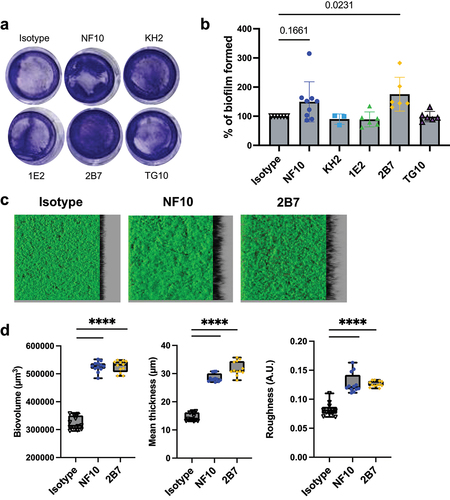
Figure 5. Anti–LMW mAbs influence C. difficile biofilm formation. Biofilm formation with CD630Δerm strain was assayed in BHISG medium supplemented with 240 µM DCA. a. Representative pictures of biofilm formed in the presence of indicated mAbs after crystal violet staining. b. Biofilm biomass was assessed by absorbance at 600 nm. Histograms show medians (middle line) and whiskers indicate standard deviation of at least three independent experiments. c. visualization mAbs-coated CD630Δerm biofilms stained with SYTO9. Z-stacks were analyzed with BiofilmQ. CLSM images are representative of three independent biological replicates. For each image, the virtual shadow projection of the biofilm is shown in dark on the right. d. Quantitative analyses were performed with BiofilmQ to measure the biovolume, thickness and roughness of the biofilms. The interquartile boxplots show medians (middle line) and the whiskers indicate minimal and maximal values of three replicative samples. Asterisks indicate statistical significance with a one-way ANOVA test followed by a Dunnett’s multiple comparison test (****p <.0001).
Supplemental Material
Download Zip (5.2 MB)Data availability statement
The authors confirm that data supporting the findings of this study are available within the article and its supplementary materials.