
Figures & data
Table 1. Summary of human gut microbiome datasets used for disease state prediction.
Figure 1. Impacts of the hyperparameters on the MicroKPNN performance for the EW-T2D dataset.
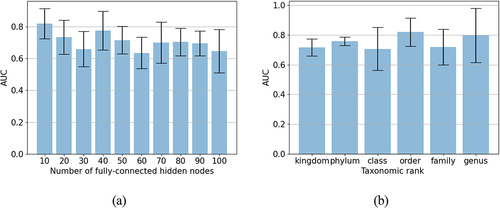
Table 2. Summary of best performing neural network architecture for each dataset and their average AUC.
Table 3. Comparison of MicroKPNN with different methods including NNs that are fully connected (fc-NN) in averaged AUC and standard deviation (in parenthesis).
Table 4. Comparison of MicroKPNN with DeepMicro in additional metrics (MCC and AUC-PR).
Figure 2. Impacts of the downsampling of samples on the different approaches for selected datasets.
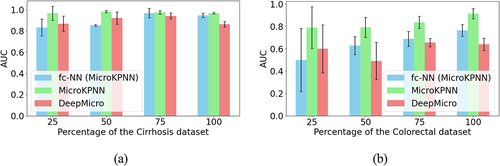
Figure 3. Contributions of the different groups of hidden nodes to the prediction as measured by importance scores. (a) IBD; (b) EW-T2D; (c) C-T2D; (d) obesity; (e) cirrhosis; (f) colorectal cancer. The boxes in different colors with whiskers show the distribution of the importance scores of the hidden nodes in different groups.
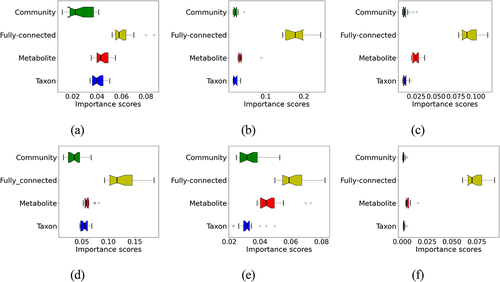
Table 5. Ranks of taxonomic groups (orders) and metabolic activities that are potentially important for microbiome-based obesity prediction.
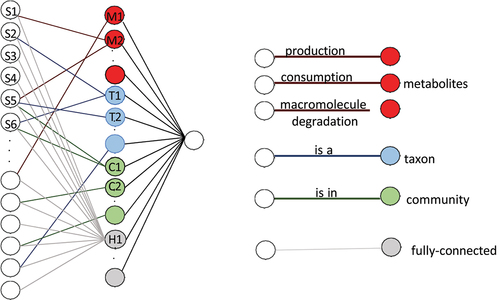
Figure 4. The neural network structure used in MicroKPNN. It is composed of three layers (shown on the left). In the input layer, each node is a species, and the hidden layer includes nodes of four different groups: metabolites (red), taxa (blue), communities (green), and fully connected hidden nodes (gray). The links between the input nodes and the nodes in the hidden layer represent different biological meanings (shown on the right).
supp.docx
Download MS Word (79.6 KB)Data availability statement
MicroKPNN is available as an open source repository at https://github.com/mgtools/MicroKPNN.