
Figures & data
Figure 1. Characteristics of the gut microbiota in the Alzheimer’s disease and wild-type mice. (a) Principal coordinates analysis (PCoA) and bacterial diversity in the Alzheimer’s disease (AD, red) and wild-type (WT, blue) mice. Each dot indicates a sample, and ellipses in PCoA contain samples with 90% confidence intervals for the groups. The Shannon and Chao1 indices for the AD and WT mice are displayed to the right and top of the PCoA plot, respectively. (b) comparison of gut microbiota (GM) similarity between the AD and WT mice. The Aitchison distances with normalized GM abundances were calculated to quantify the GM similarity among samples. Red and blue circles indicate sample distances in the AD and WT groups, respectively; yellow circles indicate the sample distances between the AD and WT mice. (c) differentially enriched genera between the AD (red) and WT (blue) mice. Asterisks indicate adjusted P-values with the global test in ANCOM-BC. (d) GM co-occurrence networks in the AD and WT mice. In the networks, each node indicates a genus and node size indicates its relative abundance. Node colors represent the taxonomical assignments at the phylum level, and the hub bacteria are labeled for the GM networks. Pink and green edges indicate positive and negative correlations, respectively; n and l indicate numbers of nodes and edges, respectively. (e) distributions of degrees in the bacterial co-occurrence networks of the AD and WT mice. (f) topological characteristics of the GM co-occurrence networks in the AD (red) and WT (blue) mice. Global test: NS, not significant; *p < .05; ***p < .001.
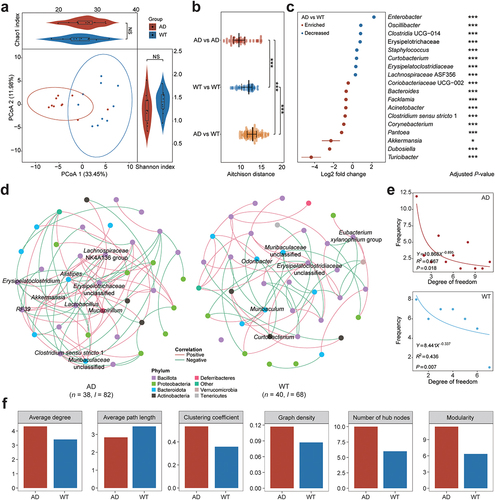
Figure 2. Comparison of gut microbial functions between the Alzheimer’s disease and wild-type mice. (a) heatmap of the differentially enriched gut microbiota (GM) metabolic pathways. Red and blue squares indicate the normalized abundances of the metabolic pathways. Top: dendrograms showing the clustering results of the samples based on the Euclidean distances of metabolic pathways. Red and blue squares indicate the Alzheimer’s disease (AD) and wild-type (WT) mice, respectively. Right: metabolic pathways involving amino acid metabolism (blue), fatty acid metabolism (red), vitamin synthase (green), and energy metabolism (purple). (b) differentially enriched neuroactive functions in the AD (red) and WT (blue) mice with (left) mean proportions of functional items and (right) 95% confidence intervals in the enriched group. (c) correlations between bacterial genera and differential neuroactive functions. Left: yellow circles indicate significant correlations between specific bacterial genera and neuroactive functions from the gut – brain module database. Right: red and blue circles indicate enriched/hub bacterial genera in the AD and WT mice, respectively.
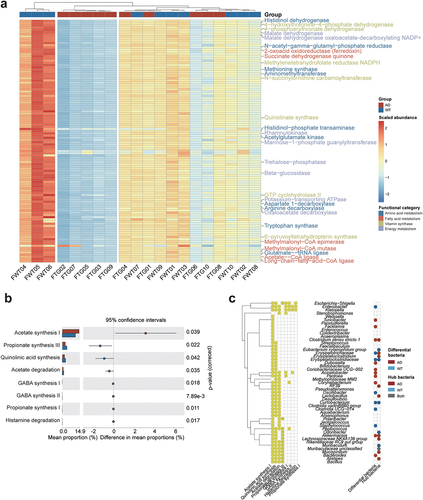
Figure 3. Characteristics of the fecal, serum, and cortical metabolomes in the Alzheimer’s disease and wild-type mice. (a) compositions of the fecal, serum, and cortical metabolomes in the Alzheimer’s disease (AD) and wild-type (WT) mice. The metabolites are classified and indicated by different colors. Arc lengths indicate the proportions of the classifications. (b) orthogonal projections to latent structures discriminant analysis (OPLS-DA) plots based on the fecal, serum, and cortical metabolomes. Red and blue dots indicate samples from the AD and WT mice, respectively. Ellipses contain samples with 90% confidence intervals for the groups. The Q2 and R2Y scores for the OPLS-DA models are shown on the lower-right corners of the plots. (c) the top 20 metabolites contributing to the OPLS-DA models constructed for different tissues were selected, and their variable importance in projection (VIP) scores are indicated by horizontal coordinates. (d) differentially enriched metabolites between the AD and WT mice. Each dot represents a metabolite. Metabolites enriched in the AD and WT mice are indicated in red and blue, respectively. The horizontal gray line represents −log10(0.05), and the vertical gray lines indicate log2(0.67) and log2(1.5), respectively.
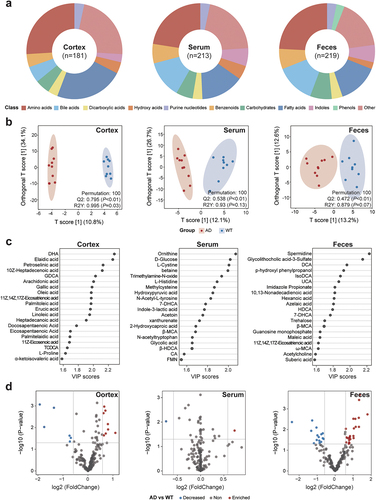
Figure 4. Associations between gut bacteria and metabolites in the feces, serum, and cortical tissues. (a) Contributions of the gut microbiota (GM) to the levels of metabolites in different sample types. Points and arrows in emperor biplots indicate metabolites and bacterial genera, respectively. The top six bacterial genera that contributed to the metabolite levels were retained. Arrows pointing in the same direction as the metabolites indicate the co-occurrence of bacterial genera and metabolites. Arrows with small angles between them indicate the occurrence of bacterial genera; different colored points indicate their classifications. (b) associations of differentially enriched bacterial genera with the key metabolites in different sample types. (c) associations of the hub bacteria with the key metabolites in different sample types. For the plots in b and c, circles and hexagons indicate bacteria and metabolites, respectively. The differential/hub bacteria in the Alzheimer’s disease (AD) and wild-type (WT) mice are indicated in red and blue, respectively. Line thickness suggests the conditional probability of the interactions between the bacteria and metabolites. DHA: 4Z,7Z,10Z,13Z,16Z,19Z-docosahexaenoic acid; FMN: riboflavin-5-monophosphate; UCA: ursocholic acid; HDCA: hyodeoxycholic acid; IsoDCA: isodeoxycholic acid; MCA: omega-muricholic acid; CA: cholic acid; TCDCA: taurochenodeoxycholic acid; 7-DHCA: 7-dehydrocholic acid; UDCA: ursodeoxycholic acid; GDCA: glycodeoxycholic acid.
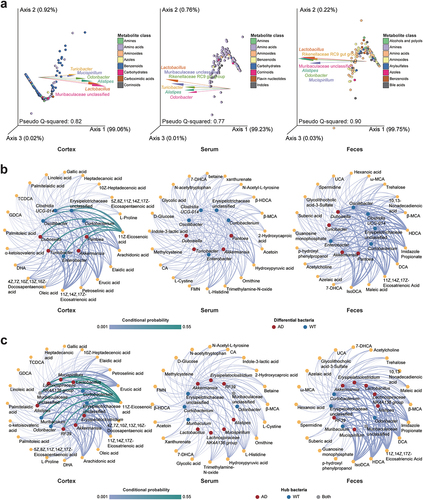
Figure 5. Mediatory effects of metabolites between gut bacteria and Alzheimer’s disease occurrence. (a) venn diagrams of the common and specific metabolites among the feces, serum, and cortical tissues. Metabolites contributed to the orthogonal projections to latent structures discriminant analysis (OPLS-DA) models were selected according to sampling site (i.e., variable importance in projection [VIP] score > 1). (b) mediatory effects of metabolites between the gut microbiota (GM) and Alzheimer’s disease (AD) occurrence. Dubosiella causally affects AD occurrence via cortical palmitoleic acid, while Erysipelatoclostridium causally affects AD occurrence via fecal deoxycholic acid (DCA). (c) mixed linear models between the metabolites and GM. In the AD mice, Dubosiella and palmitoleic acid exhibited a significant linear relationship, while Erysipelatoclostridium exhibited a significant linear association with DCA. (d) dynamic changes of palmitoleic acid and DCA from the peripheral to central tissues, respectively. Wilcoxon rank sum test: *p < .05, **p < .01, ***p < .001.
![Figure 5. Mediatory effects of metabolites between gut bacteria and Alzheimer’s disease occurrence. (a) venn diagrams of the common and specific metabolites among the feces, serum, and cortical tissues. Metabolites contributed to the orthogonal projections to latent structures discriminant analysis (OPLS-DA) models were selected according to sampling site (i.e., variable importance in projection [VIP] score > 1). (b) mediatory effects of metabolites between the gut microbiota (GM) and Alzheimer’s disease (AD) occurrence. Dubosiella causally affects AD occurrence via cortical palmitoleic acid, while Erysipelatoclostridium causally affects AD occurrence via fecal deoxycholic acid (DCA). (c) mixed linear models between the metabolites and GM. In the AD mice, Dubosiella and palmitoleic acid exhibited a significant linear relationship, while Erysipelatoclostridium exhibited a significant linear association with DCA. (d) dynamic changes of palmitoleic acid and DCA from the peripheral to central tissues, respectively. Wilcoxon rank sum test: *p < .05, **p < .01, ***p < .001.](/cms/asset/a8af6e46-ed80-4f92-b41c-03a84af752c6/kgmi_a_2302310_f0005_oc.jpg)
Figure 6. Relationships between deoxycholate and cognitive functions in humans. (a – d) regression models showing the relationships between deoxycholate (a derivative of deoxycholic acid [DCA]) and ADCS-ADL, ADAS-Cog, MMSE score, and serum insulin, respectively. ADCS-ADL: AD cooperative study–activities of daily Living; ADAS-Cog: AD assessment scale-cognitive Subscale; MMSE: mini-mental state examination.
![Figure 6. Relationships between deoxycholate and cognitive functions in humans. (a – d) regression models showing the relationships between deoxycholate (a derivative of deoxycholic acid [DCA]) and ADCS-ADL, ADAS-Cog, MMSE score, and serum insulin, respectively. ADCS-ADL: AD cooperative study–activities of daily Living; ADAS-Cog: AD assessment scale-cognitive Subscale; MMSE: mini-mental state examination.](/cms/asset/7722b928-d6a9-49e4-900a-fd4e331771f9/kgmi_a_2302310_f0006_oc.jpg)
Supplementary Figure 4.tif
Download TIFF Image (618.3 KB)Supplementary Table 2.xlsx
Download MS Excel (20 KB)Supplementary Table 1.xlsx
Download MS Excel (25.1 KB)Supplementary Table 5.csv
Download Comma-Separated Values File (49.1 KB)Supplementary Figure 5.tif
Download TIFF Image (928 KB)Supplementary Table 6.csv
Download Comma-Separated Values File (219.1 KB)Supplementary Figure 2.tif
Download TIFF Image (425.1 KB)Supplementary Figure 1.tif
Download TIFF Image (943.3 KB)Supplementary Table 4.xls
Download MS Excel (353.5 KB)Supplementary Figure 6.tiff
Download TIFF Image (958.3 KB)Supplementary Table 3.xlsx
Download MS Excel (136.1 KB)Supplementary Figure 3.tif
Download TIFF Image (830.9 KB)Supplementary Figure 7.tiff
Download TIFF Image (592.5 KB)Data availability statement
The dataset supporting the conclusions of this article is available in the NCBI Sequence Read Archive repository under BioProject accession number PRJNA815698 (https://dataview.ncbi.nlm.nih.gov/object/PRJNA815698?reviewer=4daauib1h4drvj8v5lfbc2rmhh). The code for the complex network-based gut microbiota modeling algorithm is publicly available at GitHub (https://github.com/liyinhu/GM_network_modeling). To acquire any other study information or data for reasonable uses, please kindly message the e-mail for correspondence.