
Figures & data
Figure 1. B.Theta abundance is positively correlated with the improvement of lipid metabolism dysfunction in NAFLD mice. (a) Schematic of the experimental design. (b, c) triglyceride (TG) (b) and cholesterol (CHO)(c) in the mouse liver (n = 6 ~ 7). (d) Representative liver histology visualized by H&E staining, oil red O (ORO) staining, and Masson’s trichrome staining. (e,f) NAFLD activity score (NAS) (e) and fibrosis score (f) of mouse liver (n = 6 ~ 7). (g-h) the abundance of the most prevalent gut microbiota at the family (g) and genus (h) levels analyzed by 16S rRNA gene sequencing with fecal samples (n = 5). (i) B. theta abundance at the species level (n = 5). (j) Predicted lipid metabolism-related microbiome function based on the KEGG database. (k) B. theta abundance at the species level in mice with WD/CCl4 treatment for 12 weeks. Data were presented as means with SD or represented figures. *p < .05 and **p < .01 vs. model or control group. ns, not significant. N, Control; M, WD/CCl4/DEN; B, WD/CCl4/DEN+BBR (200 mg/kg).
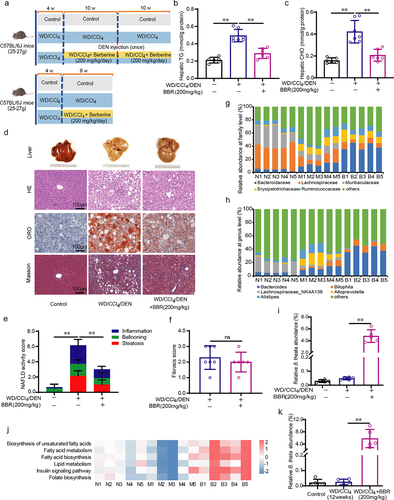
Figure 2. B. theta alleviates hyperlipidemia and insulin resistance in NAFLD mice. (a) Animal experimental schedule. (b) Body weight. (c) Body fat. (d) Average food intake per week. (e) Serum TG. (f) Serum CHO. (g) Non-fasting blood glucose. (h) Fasting insulin. (i) HOMA2-IR index. Data are presented as means with SD. n = 6, *p < .05 and **p < .01 vs. model or control group. ns, not significant.
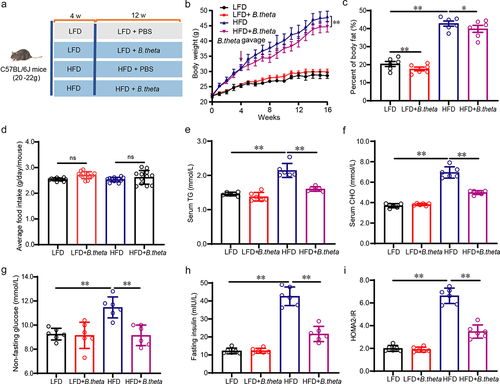
Figure 3. B. theta treatment prevents hepatic steatohepatitis and liver injury in NAFLD mice. (a) Serum ALT. (b) Serum AST. (c) Representative liver appearance, H&E staining, oil red O (ORO) staining, and F4/80 immunohistochemical stains of liver sections. (d) Liver weight. (e) Liver index; (f) quantification of NAFLD activity score (NAS), including steatosis, ballooning, and inflammation grade. (g) Liver TG. (h) Liver CHO. The data are presented as means with SD; n = 6, *p < .05 and **p < .01 vs. model or control group. ns, not significant.
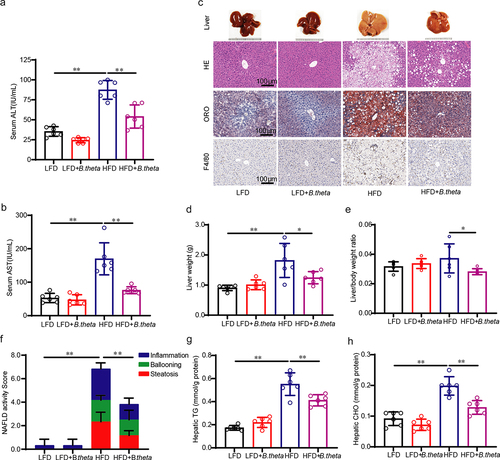
Figure 4. B. theta treatment modulates the gut microbial composition in NAFLD mice. The gut microbial composition was obtained through 16s-RNA-amplicon sequencing. (a) Plots of operational taxonomic units (OTUs). (b) Changes in microbiota diversity presented by the Simpson’s index of diversity and Shannon index. (c) Relative abundance of bacteria at the phylum level. (d) The ratio of firmicutes to Bacteroidetes. (e) Prediction of lipid metabolism-related microbiome function based on KEGG database. The data are presented as means with SD; n = 6, *p < .05 and **p < .01 vs. model or control group. ns, not significant.
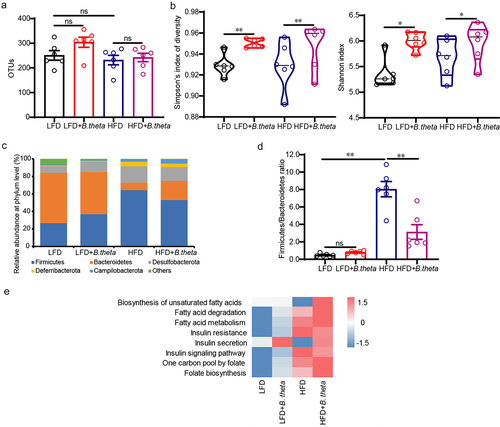
Figure 5. B. theta treatment enhances gut folate biosynthesis and modulates hepatic folate metabolism in NAFLD mice. (a) Schematic illustrates a network of folate-mediated one-carbon metabolism. (b,c) total folate level in mouse fecal (b) and liver (c). (d-f) SAM (d), GSH (e), and PC (f) in the mouse liver. (g) mRNAs related to folate-mediated one-carbon metabolism. The data are presented as means with SD; n = 6, *p < .05 and **p < .01 vs. model or control group. ns, not significant. GSH, glutathione; met, methionine; SAM, S-adenosylmethionine; SAH, S-adenosylhomocysteine; HCY, homocysteine; PE, phosphatidylethanolamine; PC, phosphatidylcholine; MS, vitamin B12-dependent methionine synthase; 5-MTHF, 5-methyltetrahydrofolate.
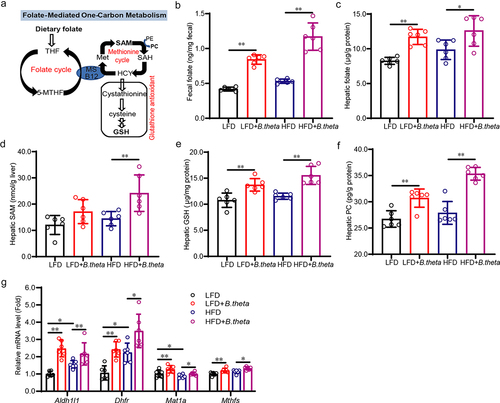
Figure 6. B. theta regulates the unsaturated fatty acid in NAFLD mice. (a) Fatty acid composition and the elongation and desaturation process. (b-e) percent composition of total SFAs (b), total MUFAs (c), C16:1 fatty acid (d), and total PUFAs (e). (f) PUFA/MUFA ratio. (g,h) the contents of C18:2, C18:3, C18:4, C20:4, C20:5, and C22:6 PUFAs; (i-k) desaturase activity of stearoyl-CoA desaturase 1 (SCD1), fatty acid desaturase 1 (FADS1) and FADS2. The data are presented as means with SD; n = 6, *p < .05 and **p < .01 vs. model or control group. ns, not significant.
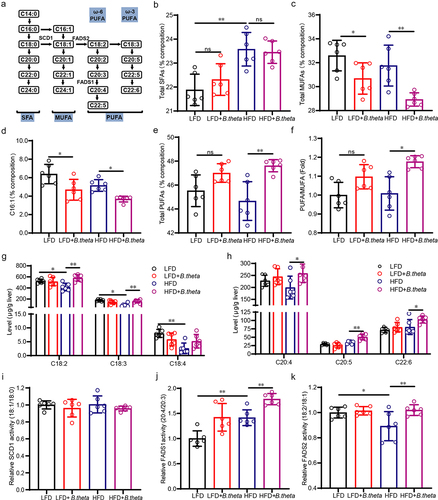
Figure 7. Bacteroides thetaiotaomicron (B. theta) administration alleviates nonalcoholic fatty liver disease (NAFLD) in HFD-induced mice through multiple mechanisms. A high-fat diet-induced fatty liver in mice accompanied by dysbiosis of gut microbiota and its metabolites. B. theta administration resulted in several beneficial effects, as indicated by the following changes: 1) increase in microbiota diversity and decrease in Firmicutes/Bacteroidetes (F/B) ratio; 2) enhancement of gut folate biosynthesis and hepatic folate metabolism; 3) increase in hepatic polyunsaturated fatty acids (PUFAs) and decrease in monounsaturated fatty acids (MUFAs) levels, with decreased PUFA/MUFA ratio. These multiple mechanisms collectively contribute to the therapeutic effects of B. theta on the development of NAFLD.
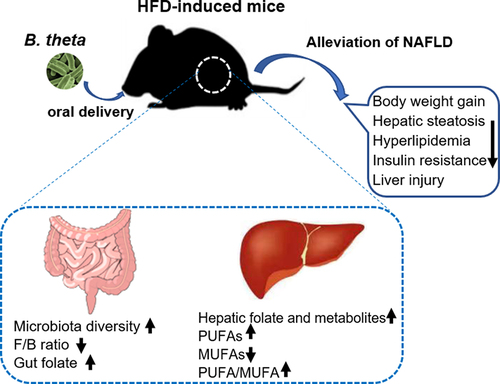
Table 1. Sequence of primers.
Data availability statement
The data that support the findings of this study are available in the article or from the corresponding author upon reasonable request.