
Figures & data
Figure 1. HMO dose determines steady-state abundance of B. infantis. (a) Gnotobiotic mice were colonized with healthy human adult stool #R01 and allowed to acclimate for 1 week, prior to treatment with 1 × 10⁸ CFU B. infantis and different amounts of HMO twice daily. Control arms included B. infantis treatment with vehicle (no HMO) and 32 mg HMO per dose without B. infantis. (b,c) 16S gene copy number, and B. infantis abundance in fecal pellets relative to total 16S gene copy number, were determined using qPCR. For samples with B. infantis signal at or below the limit of detection, values were imputed as one-half the lowest observed abundance. Data are from two independent experiments carried out under the same conditions. Data are geometric mean and geometric standard deviation, n = 4–8 per group. Significance between groups was calculated using a mixed effects model for repeated measures of log-transformed data with the Bonferroni-Sidak correction for multiple comparisons; asterisks represent statistically significant differences in the time versus treatment interaction factor for the indicated pair of conditions. (d) Individual traces for each mouse. (e) Steady state B. infantis abundance for groups receiving 1 mg HMO or higher per dose, determined as the geometric mean of values for days 12, 14, and 17 for each mouse in the indicated HMO dose groups. p-values were calculated for log-transformed data using one-way ANOVA.
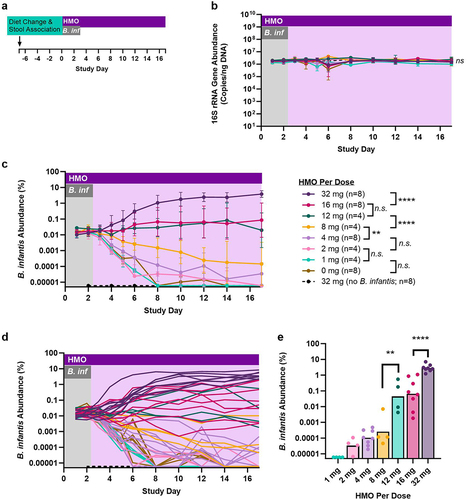
Figure 2. Metabolite analysis of cecal contents from mice treated with B. infantis and different doses of HMO. The indicated metabolites were quantified in cecal contents. (a) Heatmaps displaying the geometric mean of the metabolite quantification for each HMO dose group on day 17, log-transformed and normalized to that of the group receiving 0 mg HMO. Asterisks represent p-values compared to the 0 mg HMO group calculated using one-way ANOVA with Sidak’s posttest. (b) Geometric mean and geometric standard deviation of metabolites in cecal contents, and p-values between the indicated dose groups calculated by one-way ANOVA on all groups with Sidak’s multiple comparison test.
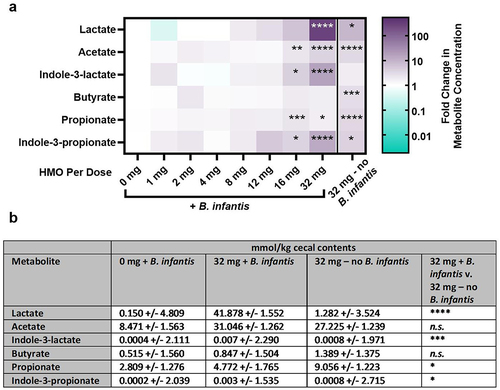
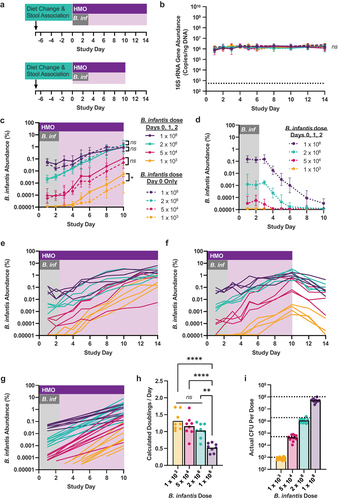
Figure 3. B. infantis expands at a similar rate regardless of starting inoculum level. (a) Gnotobiotic mice colonized with healthy human adult stool #R02 were treated with the indicated CFU of B. infantis along with HMO (16 mg) or PBS twice daily. (b,c,d) 16S gene copy number, and B. infantis abundance in DNA extracted from fecal pellets relative to total 16S gene copy number, were determined using qPCR. Data are geometric mean and geometric standard deviation for mice receiving B. infantis with HMO (b,c) or with PBS (b,d); n = 8 for groups dosed over days 0–2 from two independent experiments (solid line HMO; dotted line PBS); n = 4 for groups dosed only on day 0 in a single experiment (hatched line HMO). For samples with B. infantis signal at or below the limit of detection, values were imputed as one-half the lowest observed abundance. Significance between groups was calculated using a mixed effects model for repeated measures of log-transformed data with the Bonferroni-Sidak correction for multiple comparisons; asterisks represent statistically significant differences in the time versus treatment interaction factor for the indicated pair of conditions. (e,f) Individual traces for each mouse dosed over days 0–2 from the data plotted in (c); 4 mice in each dose cohort continued receiving HMO to day 14 (e), and the other 4 received vehicle from days 11–14 (f). (g) Linear regression of log-transformed abundance data for all mice dosed over days 0–2 with HMO dosing through day 10. Timepoints for which B. infantis was below limit of detection in the 1 × 10³ or 5 × 10⁴ dose groups were omitted to improve regression. (h) The number of doublings of B. infantis per day for each group of mice was captured from the slope of the regression lines presented in (e). (i) Quantification of B. infantis inoculum for each dose in both studies.
Data availability statement
The authors confirm that the data supporting the findings of this study are available within the article.