
Figures & data
Figure 1. PRISMA flow diagram of the study selection process. Study selection was performed according to the most recent preferred reporting items for systematic reviews and meta-analyses (PRISMA) guidelines.
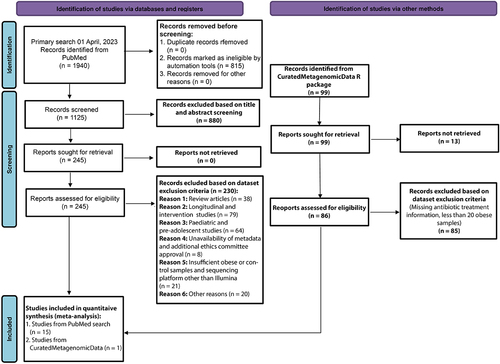
Table 1. Summary of the datasets included in the meta-analysis.
Figure 2. Reproducible taxonomic and functional microbial features across datasets identified by comparing obese and lean controls. (A) The UpSet plot showing the number of reproducible taxonomic features identified using LEfSe on MetaPhlAn3 generated species profiles shared among the datasets. Species highlighted in bold are differentially abundant in at least four datasets and were identified from species-level meta-analysis. GBR, Great Britain; UK, United Kingdom.(B) Pooled effect sizes for the 16 significant species with FDR less than 0.05 and effect size cut off ± 0.25. Red lines represent the 95% confidence interval for the random effects model estimate. Species marked in bold refer to the signatures identified from the machine learning analyses (figure 4). Species marked in ‘*’ denote reproducible contributors of obesity-associated gut microbial signature pathways, as identified from FishTaco analyses (figure 6). (C) UpSet plot showing the number of gut microbial pathway signatures identified using LEfSe on HUMAnN3 generated pathway profiles shared among datasets. Pathways highlighted in bold are differentially abundant in at least four datasets and were identified from the pathway-level meta-analysis. (D) pooled effect sizes for the 17 significant pathways with FDR less than 0.05 and effect size cut off ± 0.25. Red lines represent the 95% confidence interval for the random effects model estimate. Pathways marked in bold refer to the pathway signatures identified from the machine learning analyses. (E-F) Scatter plot of crude and age, sex, and comorbidity adjusted coefficients obtained from linear models using MetaPhlAn3 species abundances (E) and HUMAnN3 pathway abundances (F).
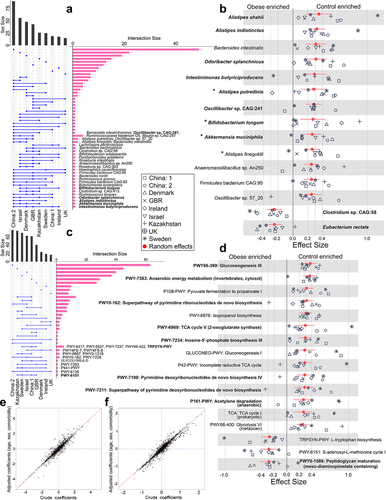
Figure 3. Identification of obesity-associated signature species required for class prediction, their dataset-specific and overall ranking across datasets. (A-B) predictive accuracy with increasing number of species features in cross-validation (CV) (A) and leave-one-dataset-out (LODO) (B) experiment obtained by using backend feature ranking algorithm of random forest classifier. (C) Representation of the rank matrix along with final median rank of top 16 species in each LODO validation making a panel of 25 unique species. Species marked in bold denote signatures also identified from species-level meta-analysis. ‘*’ marked species are the control-enriched signatures as identified from species-level meta-analysis without employing any FDR and effect size cutoffs. Rest is obese enriched. ‘†’ indicates species which were obtained as reproducible contributors of obesity-associated signature pathway shifts from FishTaco ().
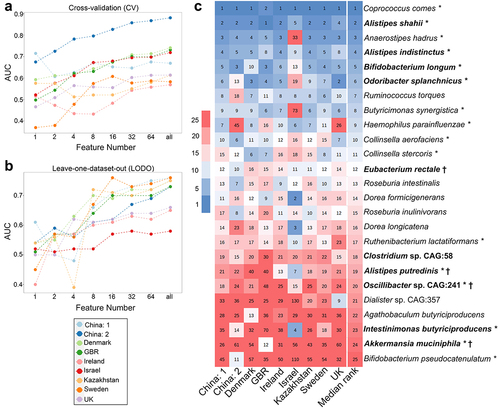
Figure 4. Identification of obesity associated signature pathways required for class prediction, their dataset-specific and overall ranking across datasets. (A-B) predictive accuracy with increasing number of pathway features in cross-validation (CV) (A) and leave-one-dataset-out (LODO) (B) experiment obtained by using backend feature ranking algorithm of random forest classifier. (C) Representation of the rank matrix along with final median rank of top 16 pathways in each LODO validation making a panel of 37 unique pathways. Pathways marked in bold denote signatures also identified from pathway-level meta-analysis. ‘*’ marked pathways are the control-enriched signatures as identified from species-level meta-analysis without employing any FDR and effect size cutoffs.
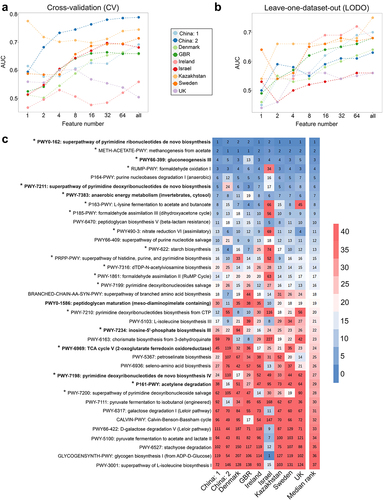
Figure 5. Prediction performance assessment of gut microbiome within and across general diet clusters and validation of signature features. (A-B) Matrix reporting prediction performances in terms of AUC values obtained from MetAML using (A) species and (B) pathway relative abundances. Diagonal values refer to average AUC obtained from 10-fold cross-validations (CV) iterated 20 times. Off-diagonal values report AUC values generated by training classifier on a dataset present in a row and validated on a dataset in the corresponding column representing cross study validation (CSV). Last rows refer to the accuracy achieved by performing LODO with the model generated exclusively using signature features associated to obesity. (C-D) Average ROC curves (over fold) obtained from LODO using (E) species and (F) pathway signature abundance data contrasting sensitivity and specificity of the learning model trained with true and shuffled class labels. (E-F) Prediction accuracy matrix for the models generated from cross-validation (CV) (using all features and signature features) in an independent French validation dataset (E) and the associated ROC curves (over fold) (F) demonstrate utilizing only signature features can yield comparable levels of accuracy to using all features. Diet clusters: BIN (British cluster comprising Great Britain, Ireland, Netherlands, and UK datasets), CHN (Chinese cluster comprising China:1, China:2 datasets); SCN (Scandinavian cluster comprising Sweden and Denmark datasets); ISR (Israeli cluster comprising Israel dataset), and KAZ (Kazakhstan comprising the Kazakhstan dataset).
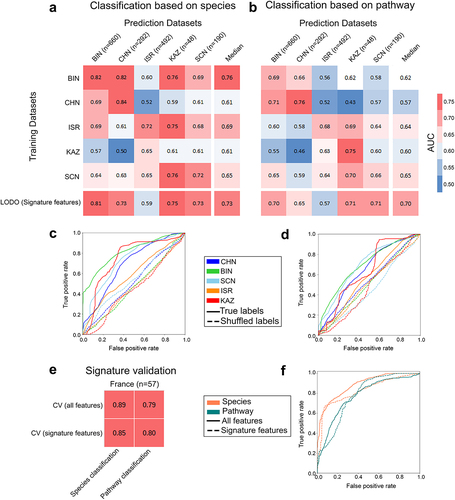
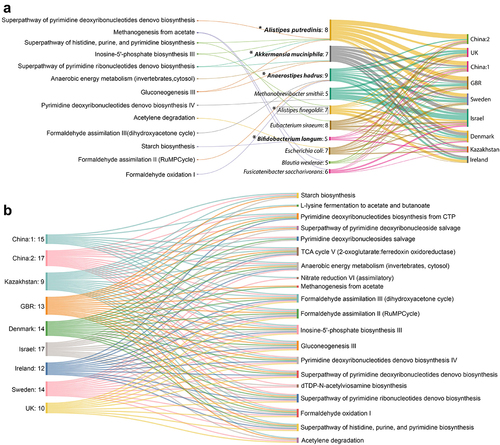
Figure 6. Reproducible contributors of the control-enriched signature pathway shifts and predictive modulation of those pathways by the minimal replicable contributor set. (A) Sankey diagram representing reproducible contributors (5 out of 9 datasets) and their contributed pathways. Values mentioned in second column denotes the number of datasets where a particular contributor drives specific functions it is connected to. Species marked in bold are the ones identified as obesity-associated signatures from MetAML and species bounded with rectangle was identified from meta-analysis. ‘*’ marked are the potential species which were predicted as the minimal set contributing to the maximum number of reproducible pathways. (B) Sankey diagram shows probable control-enriched signature pathways that can be predictively perturbed by minimal reproducible contributor set in different datasets. Values mentioned in each ‘dataset’ column represents the number of control-enriched pathways the minimal set of species directly drives.
Supplemental Material
Download Zip (220.2 KB)
Figure S10.jpg
Download JPEG Image (2.7 MB)
Data availability statement
Data sharing is not applicable to this study, as no new data were created. However, the authors confirm that the data supporting the findings of this study are available within the article, its supplementary materials, and referenced publications from which the data were extracted.