Figures & data
Figure 1. The workflow for isolating potential anti-obesity species interacting with BsS-RS06551. (a) A schematic showing the enrichment and isolation of the bacteria interacting with BsS-RS06551 using a previously constructed DBM approach. (b) The result of the obtained species. (c) The relative abundance of Bifidobacterium between healthy and obese cohorts. The relative abundance of B. longum (d) and B. pseudocatenulatum (e) between healthy and obese cohorts. *p <.0001.
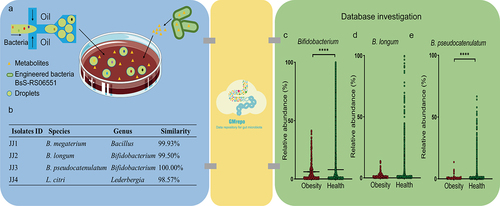
Figure 2. The effect of B. pseudocatenulatum JJ3 on high-fat diet induced obesity. (a) Experimental design. (b) Body weight change curve. (c) Cumulative weight gain. (d) Daily food intake per mouse. (e) Mesenteric, epididymal and perirenal fat weight at the end of the 10-week period. (f) Fasting glucose. (g) Fasting insulin. (h) Insulin resistance index (HOMA-IR). (i) Blood glucose curve and mean area under the curve (AUC) measured during an insulin tolerance test (ITT). (j) Blood glucose curve and mean AUC measured during an oral glucose tolerance test (OGTT). (k) Liver weight. (l) Hematoxylin and eosin (H&E) staining and oil red O staining of and livers. The scale bar is 100 µm. (m) Serum total bile acids (TBA) levels. (n) Serum alanine transaminase (ALT) levels. (o) Serum aspartate transaminase (AST) levels. (p) Serum physiological indexes. TG: triglyceride levels; TC: total cholesterol levels; LDL: low-density lipoprotein levels; HDL: high-density lipoprotein levels. *p <.05; **p <.01; ***p <.001; ****p <.0001.
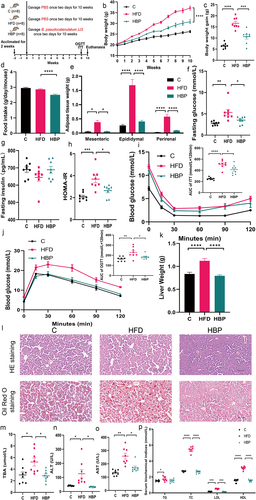
Figure 3. Co-culture of BsS-RS06551 and JJ3. (a) A schematic diagram of the co-culture setup. (b) The abundance of JJ3 under co-culture conditions with or without BsS-RS06551. (c) The abundance of BsS-RS06551 and JJ3 after mixed culture in vitro. (d) The scatter plot of the OPLS-DA model. (e) Relative quantification of five dipeptides. (f) Pathway analyses of differentially metabolites in the co-culture of BsS-RS06551 and JJ3 compared with the individual culture of BsS-RS06551. *p <.0001.
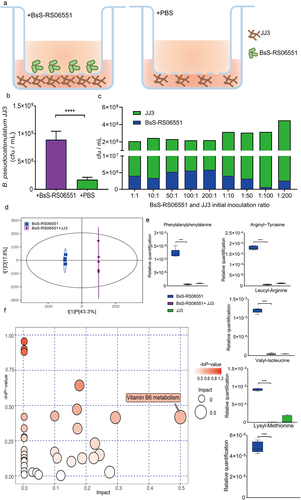
Figure 4. The microbial consortium attenuated obesity and related disorders in ob/ob mice. (a) Experimental design. (b) Changes in the body weight of ob/ob mice over 6 weeks. (c) Body weight gain. (d) LEE’s index. (e) Weekly food intake per mouse. (f) Weights of different white adipose tissues (mesenteric, epididymal and perirenal fat). (g) Fasting glucose. (h) Fasting insulin. (i) HOMA-IR. (j) Blood glucose curve and mean AUC measured during an ITT. (k) Blood glucose curve and mean AUC measured during an OGTT. (l) H&E staining and oil red O staining of and livers. The scale bar is 100 µm. (m) Liver weights. (n) Serum TBA levels. (o) Serum ALT levels. (p) Serum alkaline phosphatase (ALP) levels. (q) Serum AST levels. (r) Serum physiological and biochemical indices. *p <.05; **p <.01; ***p <.001; ****p <.0001.
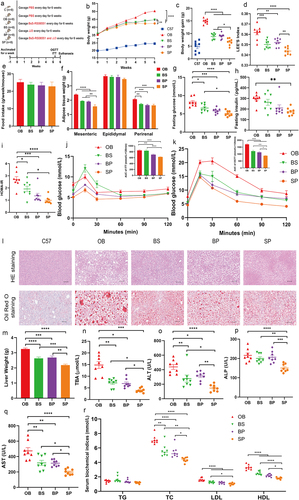
Figure 5. The synthetic microbial consortium modulated the gut microbiota of ob/ob mice. (a) Alpha diversity analysis. (b) Principal Co-ordinates analysis (PCoA) based on Bray_Curtis distance. (c) The top 50 relative abundance genera. (d) The ternary plot among the BS, BP and SP groups. (e) Ecological network among differential bacteria in BS, BP and SP groups. (f) The correlation analysis between obesity-related metabolic indicators and differential bacteria. *p <.05; **p <.01.
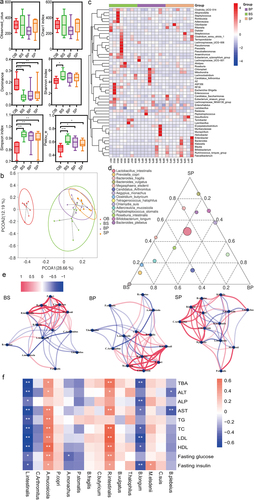
Figure 6. Analysis of metabolites and pathways under different interventions. (a) Differential metabolite classification and proportion. (b) PCA models of all groups. OPLS-DA models for groups BS vs OB (c), BP vs OB (d), SP vs OB (e). Volcano plots for groups BS vs OB (f), BP vs OB (g), SP vs OB (h).
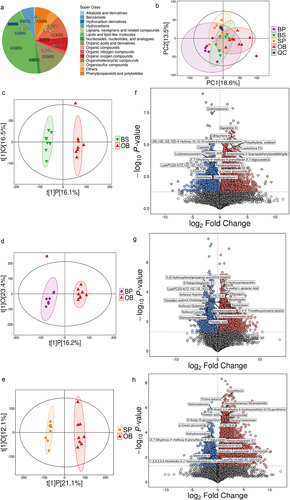
Figure 7. Effects of the synthetic microbial consortium on metabolite and pathway interventions. Pathway analyses for groups SP vs BS (a), SP vs BP (b), SP vs OB (c). (d) Heatmap of differential metabolites involved in enriched metabolic pathways. (e) The correlation analysis between obesity-related metabolic indicators and differential metabolites. (f) Differential metabolites correlation analysis. Linear association between pyridoxal 5’-phosphate (g), pyridoxamine (h), 4-pyridoxic acid (i) and B. longum. *p <.05; **p <.01.
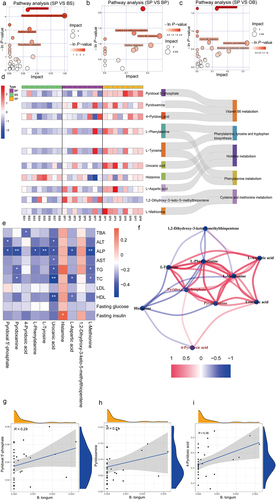
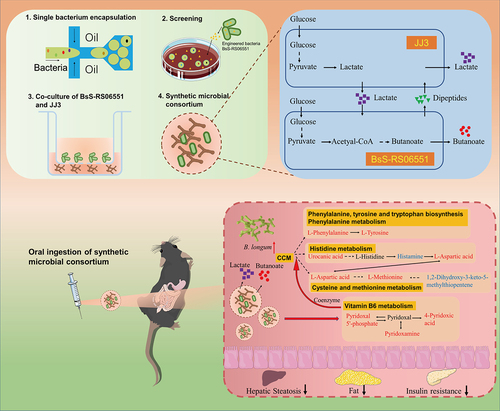
Figure 8. The summary of the possibilities to explain the more beneficial effect of synthetic microbial consortium on ob/ob mice compare to the individual strains of BsS-RS06551 and JJ3. Red and blue represent up- and down-regulated metabolites, respectively.