
Figures & data
Table 1. Characteristics of the participants for serum and fecal samples collecting.
Table 2. Primer Sequences for Relative Quantitative RT-PCR.
Table 3. siRNA-GPR109A Sequences.
Table 4. siRNA-HOPX Sequences.
Table 5. Sh-RNA-HOPX Sequences.
Figure 1. (a) Differential analysis of microbial community composition in feces at the genus level between gastric cancer (GC) patients (GC, n = 20) and healthy individuals (Normal, n = 20). Differential analysis was performed on all species at each level, with the bar graph showing the top 30 species with p-values <0.05 and including differential species. Differential species were shown on the x-axis (arranged in order of abundance from left to right) and the y-axis indicated relative abundance. Bar heights indicated relative abundance of species in the different groups. (b) PCoA 2D plot: the green represented Normal and the red performed GC, and the closer the samples were, the more similar their microbial community structured, indicating less variation. (c) Violin plot: the p-value in the upper left corner represented the results of the rank-sum test for GC and Normal groups in the plot. * significant difference, ** highly significant difference, ns, non-significant difference. (d-e) GC-MS analysis of SCFA contents, including acetic, propionic, butyric, isobutyric, valeric, and isovaleric acids, in the feces (D) and serum (E) of GC patients (n = 20) and healthy individuals (n = 20). (f-g) Immunohistochemical and immunofluorescence analysis of levels of GPR109A, GPR43, and GPR41 in cancer and adjacent tissues from GC patients (n = 50 to 60 pairs). (h) mRNA expression of GPR109A, GPR43, and GPR41 in tumor and control tissues from GC patients (n = 6 pairs). (i) Western blotting of SCFA receptors (GPR109A/GPR43/GPR41) in GES-1 and GC cell lines MGC-803, HGC-27, and SNU-216, together with changes in expression after 10 mM Ac and 5 mM Bu treatment. Data indicate the mean ± SD. *p < .05, **p < .01, and ***p < .001, by 2-tailed Student’s t test or one-way ANOVA. Mann-Whitney U test was used for differential comparison of two groups of samples with biological replicates; Kruskal-Wallis test was used for comparison of multiple groups of samples with biological replicates. p < 0.05 was considered statistically significant.
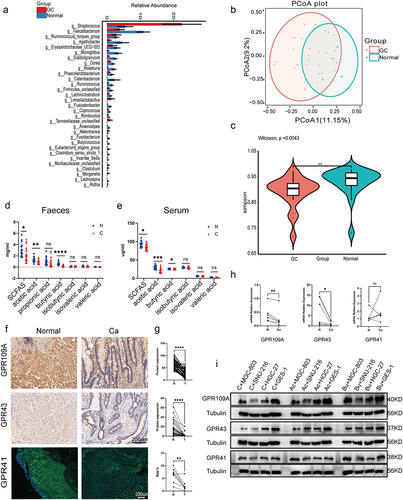
Figure 2. ABX mouse transplantation of GC patients and normal individuals’ fecal microbiota was induced GC with H. pylori SS1+MNU treatment. Groups: mice transplanted with normal human microbiota (F-N), GC microbiota (F-CA), pbs (F-MNU), and mice without induction and treatment (Control) (−6 + 36 w). (a) Macroscopic observation of GC induction at − 6 + 36 weeks after fecal microbiota transplantation. (b) Illustration depicting microbiota transplantation in conjunction with the gastric cancer induction model. (c-d) the number and maximum volume of induced tumors were observed in the three groups (F-N, F-CA, F-MNU). (e) HE staining of mouse gastric tissue in the three groups. (f)PCoA 2D plot of there groups: the green: F-N, the blue: F-MNU, the red: F-CA, the dots were, the more similar their microbial community structured, indicating less variation. The microbial compositional structures in feces exhibited disparities between the two groups. (g) Violin plot: the p-value in the upper left corner represents the results of the rank-sum test for F-N and F-CA groups in the plot. (h) Differences in microbiota species between F-N and F-CA. Species were shown on the x-axis (arranged according to abundance from left to right) and relative abundance on the y-axis. Bar heights represented abundance of species in the different groups. n = 10 mice/group, but F-N = 6. (i-j) GC-MS analysis of the SCFA contents in feces (I) and sera (J) of mouse transplantation groups (F-N, F-CA, F-MNU). n = 5 to 6 mice/group, cages = 2 to 3/group. Data indicate the mean ± SD. *p < .05, **p < .01, and ***p < .001, by 2-tailed Student’s t test or one-way ANOVA. Mann-Whitney U test was used for differential comparison of two groups of samples with biological replicates; Kruskal-Wallis test was used for comparison of multiple groups of samples with biological replicates. p < .05 was considered statistically significant.
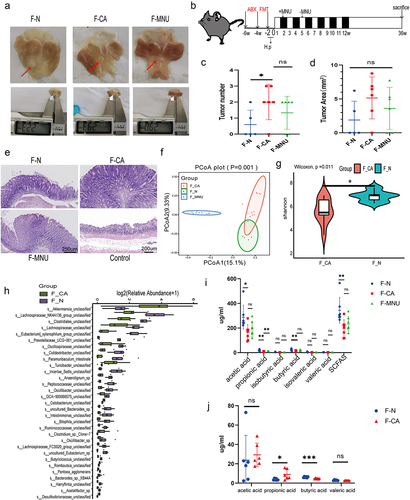
Figure 3. (a-b) Proliferation in control GES-1 cells and GC MGC-803, HGC-27, and SNU-216 cells after treatment with varying concentrations of Ac (0, 10, 20, 40 mmol/L) and Bu (0, 5, 10, 15 mmol/L). (c-f) Proliferation in control GES-1 cells and GC cells at 0, 12, 24, and 48 hours of treatment with 10 mM Ac or 5 mM Bu. (g) Apoptosis in cells treated with 10 mM Ac or 5 mM Bu. Data indicate the mean ± SD. *p < .05, **p < .01, and ***p < .001, by 2-tailed Student’s t test or one-way ANOVA.
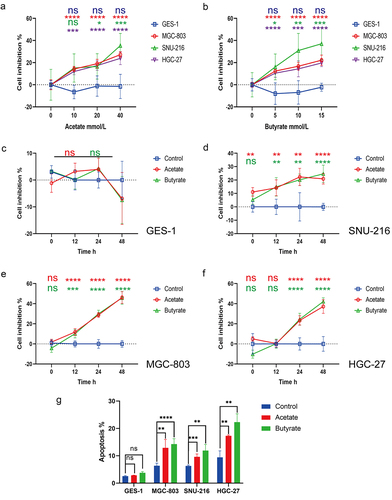
Figure 4. (a) Differences in protein expression of Bcl-2, Bax, and cleaved-caspase 3 after treatment with 10 mM Ac or 5 mM Bu in GES-1 cells. (b-c) Differences in protein expression of Cyclin D1, Bcl-2, Bax, and cleaved-caspase 3 after treatment with 10 mM Ac or 5 mM Bu in GPR109A-knockdown GC cells. (d-g) Changes in cell proliferation (d-e) and apoptosis (f-g) were observed in MGC-803 and HGC-27 cells after siRNA-mediated knockdown of GPR109A and treatment with Ac or Bu. (h) Co-immunoprecipitation confirmed the interaction between GPR109A and HOPX proteins. (i) Differences in HOPX protein expression were detected by IHC in cancer and adjacent tissues of GC patients. (j) Quantification of the results of (I). (k-l) Differences in the co-localization of GPR109A and HOPX between the GC cell lines MGC-803 and HGC-27 after siRNA-mediated knockdown of GPR109A combinated with 5 mM Bu. (m) Differences in the expression of apoptosis-related proteins Bcl-2, Bax, and cleaved-caspase 3 were observed in MGC-803 and HGC-27 cells after siRNA-mediated knockdown of GPR109A and HOPX, knockdown of GPR109A, or overexpression of HOPX. (n) Differences in the expression of apoptotic and anti-apoptotic-related proteins were scrutinized after (M) combinated with 5 mM Bu. (o-p) Changes in cell apoptosis rates after the (M) treatment. (q-r) Changes in cell apoptosis rates after the (N) treatment. Data indicate the mean ± SD. *p < .05, **p < .01, and ***p < .001, by 2-tailed Student’s t test or one-way ANOVA.
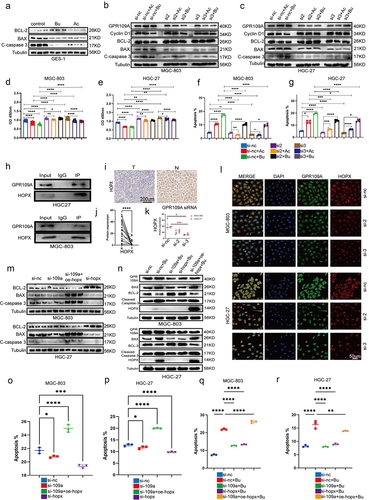
Figure 5. At week 12 following the induction of GC with H. pylori SS1+MNU, wild-type and GPR109A−/− mice were supplemented with either Bu or a high-fiber diet (HF) until week 38 (−2 + 38 w). Tissue samples were collected from the mice in the different groups, including the wild-type group supplemented with high-fiber diet (MNU+HF), the wild-type group supplemented with Bu in the drinking water (Mnu+bu), the wild-type group (MNU), the GPR109A−/− group (MNU+GPR109A−/−), and the GPR109A −/− group supplemented with Bu in the drinking water (MNU+GPR109A−/−+Bu). (a-b) the gross morphology of the stomachs, (c) tumor numbers, and (d) maximum tumor volumes in the mice were recorded for the five groups. (e) HE staining was used to observe the morphological characteristics of mouse gastric tissues in each group. (f) immunohistochemistry was used to detect differences in the protein expression of tumor-related markers Ki-67 and CK-7, as well as GPR109A, HOPX, CD8, and IFN-γ for the five groups. (g-k) Quantification of the results of (F). (l) Differences in the expression of GPR109A, HOPX, CD8, and IFN-γ detected by Western Blotting in GC tumors. (m) Quantification of the results of (L). n = 4 to 6 mice/group, cages = 2 to 3/group, cages = 2 to 3/group. Data indicate the mean ± SD. *p < .05, **p < .01, and ***p < .001, by 2-tailed Student’s t test or one-way ANOVA.
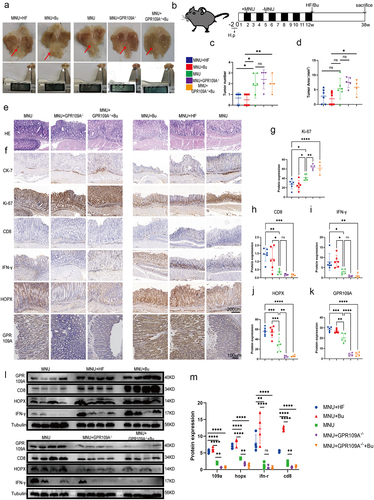
Figure 6. Mice with H. pylori SS1+MNU-induced GC were supplemented with Bu (Mnu+bu) from 30 weeks to 52 weeks (−2 + 52 w). (a-b) Macroscopic observations of the stomachs, (c) tumor numbers, and (d) maximum tumor volumes were compared between the MNU and MNU+Bu groups (−2 + 52 w). (e) HE staining and (f) Immunohistochemical staining of the tumor-associated markers Ki-67 and CK-7, and GPR109A, HOPX, and IFN-γ in gastric tissues from the MNU and MNU+Bu groups. (g-j) Quantification of the results of (f). n = 5 mice/group, cages = 2 to 3/group, cages = 2 to 3/group. Data indicate the mean ± SD. *p < .05, **p < .01, and ***p < .001, by 2-tailed Student’s t test or one-way ANOVA.
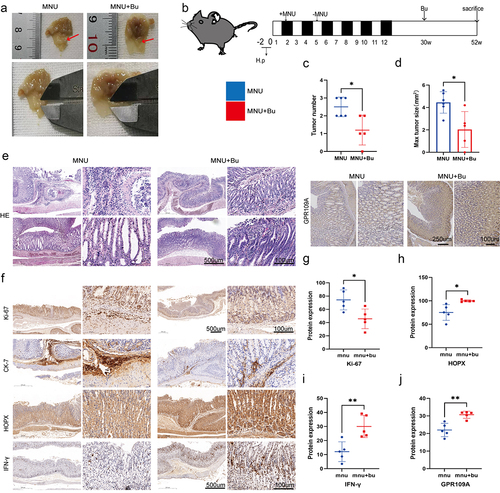
Figure 7. Groups: mice transplanted with normal human microbiota (F-N), GC microbiota (F-CA), pbs (F-MNU), and mice without induction and treatment (Control) (−6 + 36 w). (a) Immunohistochemical analysis of levels of the tumor-related indicators Ki-67 and CK-7 protein in gastric tissue of each group, together with the differential expression of GPR109A, HOPX, CD8, and IFN-γ proteins. (b-f) Quantification of the results of (A). (g) Western blotting of GPR109A, HOPX, CD8, and IFN-γ proteins in gastric tumor tissue of the different groups. (h) Quantification of the results of (G). n = 5 to 6 mice/group, cages = 2 to 3/group, cages = 2 to 3/group. Data indicate the mean ± SD. *p < .05, **p < .01, and ***p < .001, by 2-tailed Student’s t test or one-way ANOVA.
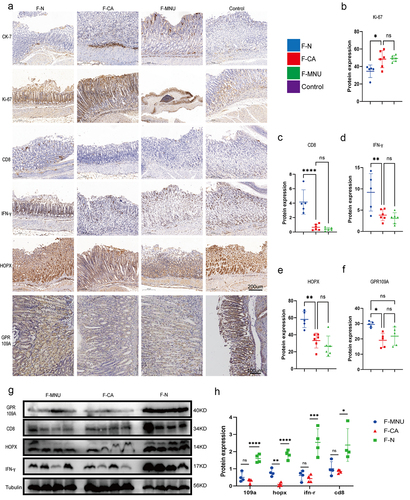
Figure 8. (a) Flow cytometry analysis of the proportions of CD3+ T, CD4+ T, CD8+ T, CD25+ FOXP3+ Treg cells, and DCs cells in mouse peripheral blood in the MNU and MNU+Bu groups (−2 + 52 w). (b) Quantitative statistical analysis of the fluorescence colocalization of (c). Positive cell rate (%). (c) Immunofluorescence staining showing the co-expression of CD8 and IFN-γ in the two groups. (d-e) Flow cytometry analysis of the proportions of DCs and CD3+ T, CD4+ T, and CD8+ T cells in mouse gastric tumor tissues and peripheral blood in the different groups (MNU+HF, MNU+Bu, MNU, MNU+GPR109A−/−, MNU+GPR109A−/−+Bu) (−2 + 38 w). (f) The co-expression of CD8 and IFN-γ in the five groups. (g) Quantitative statistical analysis of the fluorescence colocalization of (F). Positive cell rate (%). (h) Quantitative statistical analysis of the fluorescence colocalization of (I). Positive cell rate (%). (i) The co-expression of CD8 and IFN-γ in the groups (F-N, F-CA, F-MNU) (−6 + 36 w). (j-k) Flow cytometry analysis of the proportions of DCs and CD3+ T, CD4+ T, and CD8+ T cells in mouse gastric tumor tissues and peripheral blood in the three (F-N, F-CA, F-MNU) groups. n = 4 to 6 mice/group, cages = 2 to 3/group, cages = 2 to 3/group. Data indicate the mean ± SD. *p < .05, **p < .01, and ***p < .001, by 2-tailed Student’s t test or one-way ANOVA.
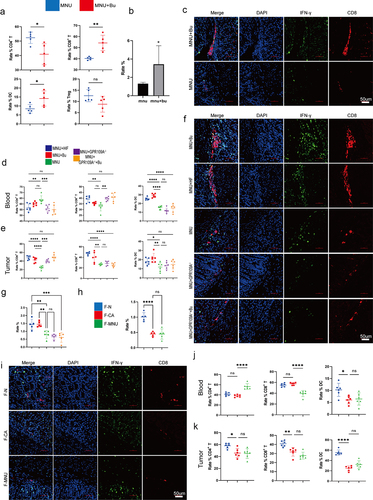
Figure 9. (a) Co-localization of GPR109A and HOPX proteins in CD8+ T cells. (b-c) Co-localization of CD8 and GPR109A shown by immunofluorescence in mouse gastric tissue in the MNU and MNU+Bu groups (−2 + 52 w). (d) Changes in the proportion of IFN-γ positive cells in the CD8+ T cell group after treatment with different concentrations of Bu. (e-f) Changes in the proliferation of CD8+ T cells after treatment with different concentrations of Bu (e) or GPR109A inhibitors (f). (g) Changes in the proportion of IFN-γ-positive CD8+ T cells after treatment with Bu together with GPR109A inhibitors, HOPX knockdown, or HOPX overexpression. (h-i) Changes in the apoptotic rates (h) and the altered cytotoxicity (i) of tumor cells induced by CD8+ T cells after treatment with Bu together with GPR109A inhibitors, HOPX knockdown, or HOPX overexpression, co-cultured with MGC-803 or HGC-27. (j) Simplified diagram of CAR-claudin18.2 sequence. (k) Infection efficiency of primary CD8+ T cells by CAR-claudin18.2 lentivirus. (l) Differences in the level of Claudin 18.2 proteins in HGC-27, MGC-803 and GES-1 cells detected by western blotting. (m) Fluorescence images showing claudin18.2 protein expression in GC tumor tissue and adjacent tissue. (n-q) groups: UTD, CAR-T, CAR-T+Bu. (n) Apoptosis rate of GC cells MGC-803 or HGC-27 after co-cultivation with CAR-claudin18.2+ CD8+ T cells or combined with Bu. (o) Cytotoxicity of CAR-claudin18.2+ CD8+ T cells or combined with Bu against MGC-803 or HGC-27 gastric cancer cells. (p-q) Flow cytometry analysis of IFN-γ and Granzyme B positive expression in CAR-claudin18.2+ CD8+ T cells after co-cultivation with MGC-803 or HGC-27 GC cells, either alone or combined with Bu. (r-t) groups: Bu+nc, Bu + 109a blocker, Bu+sh-hopx, Bu + 109a blocker+oe-hopx. (r) The altered cytotoxicity of GC cells induced by CAR-claudin18.2+ CD8+ T cells after treatment with Bu together with GPR109A inhibitors, HOPX knockdown, or HOPX overexpression, co-cultured with MGC-803 or HGC-27. (s-t) Changes in the proportion of IFN-γ+ or Granzyme B+ CAR-claudin18.2+ CD8+ T cells after the same treatment (r). Data indicate the mean ± SD. *p < .05, **p < .01, and ***p < .001, by 2-tailed Student’s t test or one-way ANOVA.
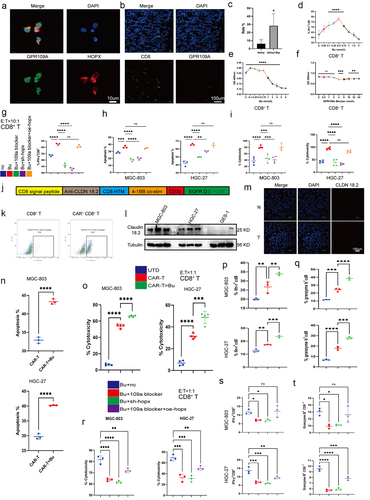
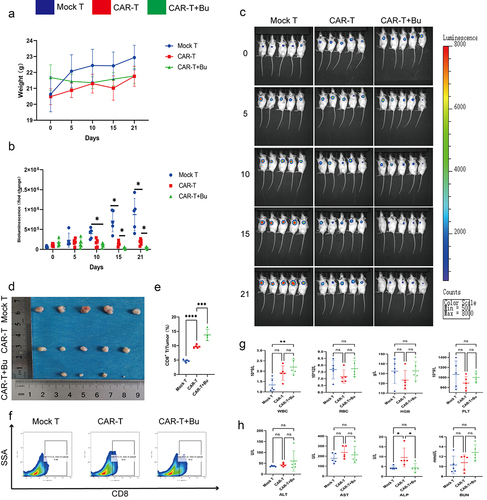
Figure 10. CAR-claudin18.2+ CD8+ T cells were administered in conjunction with 0.5 mmol/L Butyrate for the treatment of subcutaneous MGC-803 tumors. groups: Mock T, CAR-T, CAR-T+Bu. (a) Analysis of body weight fluctuations. (b) Live imaging statistical analysis of (C). (c) In vivo imaging conducted on days 0, 5, 10, 15, and 21. (d) Tumor size was measured after 23 days of treatment. (e-f) Flow cytometry analysis revealed the proportion of CD8+ T cells within the tumor. (g) Hematological analysis showed variations in WBC, RBC, HGB, and PLT. (h) Blood biochemistry examination reflected changes in ALT, AST, ALP, and BUN levels. The data represent the mean ± SD. *p < .05, **p < .01, and ***p < .001, as determined by a two-tailed Student’s t-test or one-way ANOVA.
R2 revision_supplemental figures and tables clean.docx
Download MS Word (90.4 MB)Data availability statement
The 16S rRNA sequencing data have been deposited in the NCBI BioProject database (https://www.ncbi.nlm.nih.gov/bioproject/) under accession numbers PRJNA976526 and PRJNA976543.