
Figures & data
Figure 1. Human data.
(a) Study design. (b) Phylum composition. (c) Relative abundance (%) of Firmicutes and Bacteroides in fecal samples from healthy and MASLD patients. (d) Genus levels of stool samples and levels of B. bifidum and B. longum in stool samples from healthy and MASLD patients. (e) Concentrations of tryptophan and indole derivatives in stools of MASLD patients compared to HC. (f) Volcano plots of statistically significant other common metabolites compared with HC group and MASLD patient. The x-axis is the log2-fold change, and the y-axis is the log10-p value.
All data are expressed as mean±SEM. Statistical analysis was performed using independent samples T test. Compared with HC, *p < .05, **p < .01, ***p < .001 as indicated.
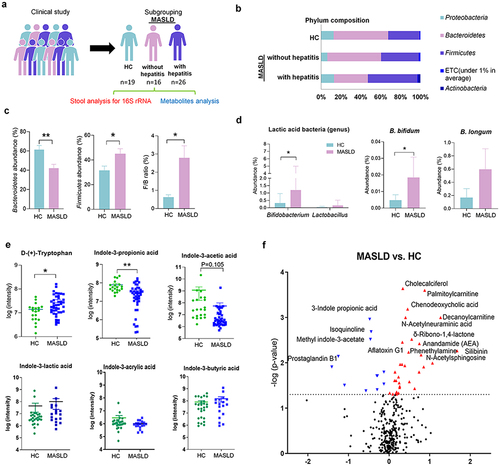
Figure 2. IPA and IAA ameliorate WD-induced hepatic steatosis.
(a – d) 6-week-old C57BL/6J mice acclimated to standard food for 1 week. They were then maintained on standard food or WD for 12 weeks and provided IPA (0.1 mg/ml in water) and IAA (0.1 mg/ml in water). (a) WD animal experimental model design. (b) L/B ratio (n = 4–5 per group). (c) Comparison of histological NAS calculated from hematoxylin and eosin stained liver tissue (n = 4–5 per group). (d) Effects of WD and IPA and IAA on serum ALT, AST, TG, and CHOL levels (n = 4–5 per group).
All data are expressed as mean±SEM. Statistical analysis was performed using post hoc Sidak’s multiple comparisons and one-way ANOVA tests. *p < .05, **p < .01, ***p < .001 as indicated compared to WD group. ###p < .001 as indicated compared to the NC group.
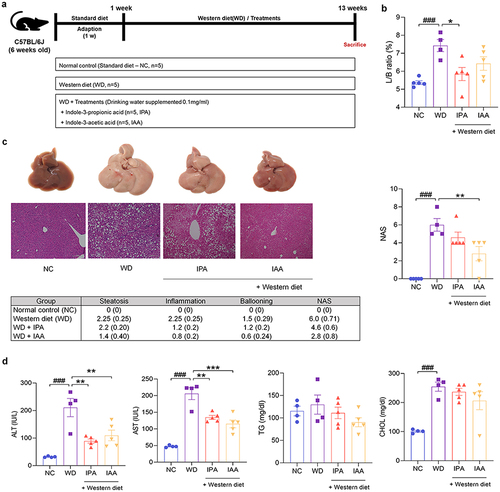
Figure 3. Administration of IPA and IAA alleviates WD-induced hepatic steatosis and inflammation in mice.
(a – d) Liver tissues were collected from NC and WD groups and mice treated with IPA and IAA for 12 weeks to measure Mrna expression levels. (a) Mrna levels of Tnf-α, Il-1β, and Il-6 in the liver of mice (n = 5 per group). (b) mRNA levels of Cxcl10 in the liver of mice (n = 5 per group). (c) mRNA levels of Cpt1a, Ppar-α, and Acox1 in mouse liver (n = 5 per group). (d) mRNA levels of Srebp-1c, Fasn, Ppar-γ, Acc1, and Cd36 in mouse liver (n = 5 per group). (e) mRNA levels of Ahr, Cyp1b1 and Cyp1a2 in the ileum of mice (n = 5 per group). (f) TEER test with IPA and IAA.
All data are expressed as mean±SEM. Statistical analysis was performed using post hoc Sidak’s multiple comparisons and one-way ANOVA tests. *p < .05, **p < .01, ***p < .001 as indicated compared to WD group. #p < .05, ##p < .001 as indicated compared to the NC group.
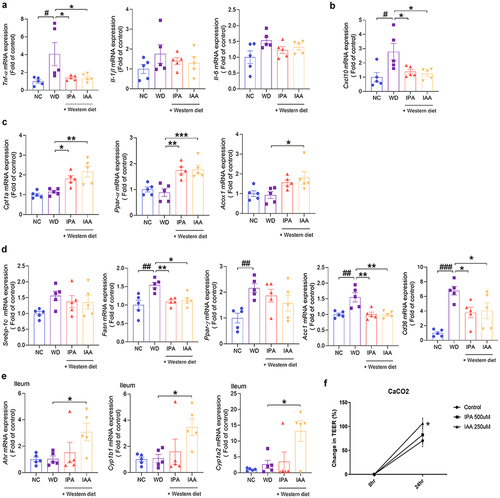
Figure 4. Administration of IPA and IAA suppresses the increase in endotoxin and the inflammatory response caused by WD.
(a – e) liver tissues were collected from mice treated with IPA and IAA for 12 weeks and from NC and WD groups to measure mRNA expression and protein levels. (a) Tlr4 mRNA levels in mouse liver (n = 5 per group). (b) Western blot quantification of Tlr4 in mouse liver (n = 4 per group). (c) LBP level in serum using LBP assay kit (n = 4 per group). (d) mRNA levels of Ccl2 and Ccl5 in mouse liver (n = 5 per group). (e) Western blot quantification of NF-kB activation in mouse liver (n = 3 per group). (f – g) Raw264.7 cells were dose-dependently pretreated with IPA and IAA for 12 h and then treated with LPS (10 ng/ml) for 6 h. (f) IPA-treated Tnf-α and Ccl2 mRNA expression levels (n = 3 per group). (g) IAA-treated Tnf-α and Ccl2 mRNA expression levels (n = 3 per group). (h and i) mRNA levels of Ahr with IPA and IAA treatment on Raw264.7 cell and CaCo2 cells.
All data are expressed as mean±SEM. Statistical analysis was performed using post hoc Sidak’s multiple comparisons and one-way ANOVA tests. *p < .05, **p < .01, ***p < .001 as indicated compared to WD group. #p < .05, ##p < .01, ###p < .001 as indicated compared to the NC group.
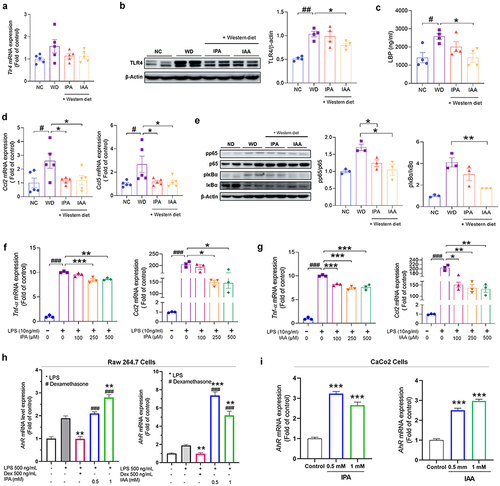
Figure 5. IPA and IAA treatment altered transcriptomic in the liver.
(a – g) Liver tissues were collected from mice treated with IPA and IAA for 12 weeks and from NC and WD groups to perform RNA-Seq analysis. (a) DEGs heatmap for WD/NC, IPA/WD, and IAA/WD (n = 3 per group). (b) Bar chart of genes involved in GO biological processes up- and down-regulated by IPA and IAA administration (n = 3 per group). (c) Expression similarity between samples by principal component analysis (n = 3 per group). (d) Gene set enrichment analysis for KEGG items (n = 3 per group). (e) Venn diagram showing specific or common differentially expressed genes between IPA/WD and IAA/WD (n = 3 per group). (f) Heatmap showing 43 genes commonly up- or down-expressed between IPA/WD and IAA/WD (n = 3 per group). (g) Network visualization showing 43 gene correlations based on protein-protein Interaction database (n = 3 per group).
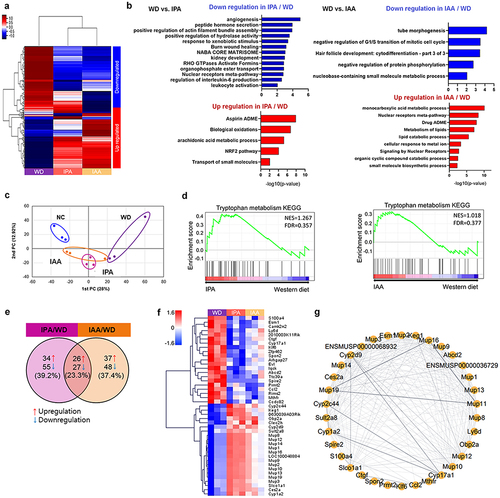
Figure 6. Modulating microbial taxonomic abundance of IPA and IAA on WD-induced changes.
(a – f) Cecal samples were collected from mice treated with IPA and IAA for 12 weeks and from the NC and WD groups. (a) Alpha diversity based on species richness in cecal samples from NC, WD, IPA, and IAA (n = 3 per group). (b) Beta diversity was plotted as a PCoA plot showing the similarity of bacterial community structure based on Bray Curtis (n = 3 per group). (c) UPGMA clustering shows sample similarity based on Bray Curtis. Relative group abundance at the species level (n = 3 per group). (d) Phylum-level microbial composition in cecal samples from NC, WD, IPA, and IAA. Abundance and relative abundance (%) of the two major phyla, Firmicutes and Bacteroides (n = 3 per group). (e)Relative abundance of bifidobacterium genera in cecal samples from NC, WD, IPA, and IAA (n = 3 per group). Statistical analysis was performed using independent samples T test. *p < .05. (f) IAA production assay of the bacterial isolates in vitro by Salkowski assay. (g) OD600 was measured at 0, 3, 6, 12, 24, 48, and 72 h in anaerobic cultures of B. bifidum with and without tryptophan. It was measured at 0, 3, 6, 12, 24, 48, and 72 h in an anaerobic culture medium with and without tryptophan by salkowski test (n = 3 per group).
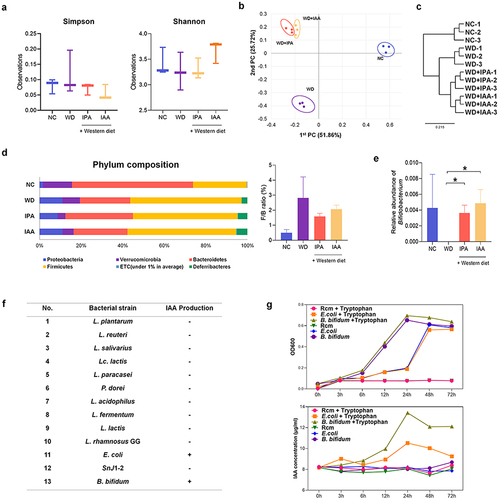
Figure 7. B. bifidum ameliorates WD-induced hepatic steatosis.
(a – d) 6-week-old C57BL/6J mice were acclimated to standard food for 1 week. They were then maintained on standard food or WD for 12 weeks and Trp (0.25% w/v in water) and bacteria were given orally at 100 μL (109 CFU/mouse in PBS) daily. (a) WD animal experimental model design. (b) L/B ratio (n = 4–8 per group). (c) Comparison of histological NAFLD activity scores calculated from hematoxylin and eosin (H&E) stained liver tissue (n = 4–8 per group). (d) Effects of WD and IPA and IAA on serum ALT, AST, TG and CHOL levels (n = 4–8 per group).
All data are expressed as mean±SEM. Statistical analysis was performed using post hoc Sidak’s multiple comparisons and one-way ANOVA tests. *p < .05, **p < .01, ***p < .001 as indicated compared to the WD group. ###p < .001 shown compared to NC group. Trp, tryptophan; LP, L. plantarum Q180; BB, B. bifidum.
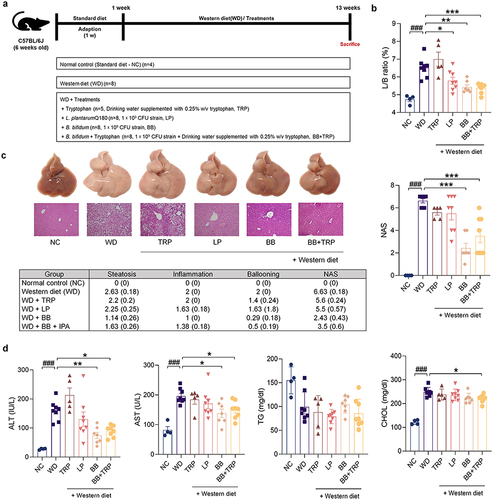
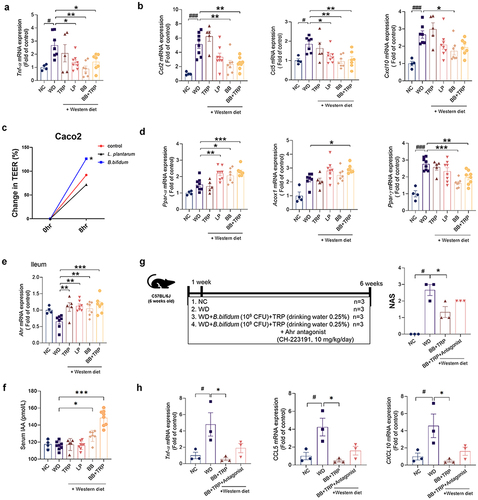
Figure 8. Administration of B. bifidum alleviates WD-induced hepatic steatosis and inflammation in mice.
(a, b, and d) Liver tissues were collected from NC and WD groups and mice treated with TRP, L, plantarum, and B. bifidum for 12 weeks to measure mRNA expression levels. (a) mRNA levels of Tnf-α in mouse liver (n = 4–8 per group). (b) mRNA levels of Ccl2, Ccl5 and Cxcl10 in mouse liver (n = 4–8 per group). (c) TEER test with L, plantarum and B. bifidum. (d) mRNA levels of Ppar-α, Acox1, and Ppar-γ in mouse liver (n = 4–8 per group). (e) mRNA levels of Ahr in mouse ileum (n = 4–8 per group). (f) IAA enzyme-linked immunosorbent assay in serum of mice treated with NC and WD groups and TRP, L, plantarum, and B. bifidum for 12 weeks. (g-h) 6-week-old C57BL/6J mice were acclimated to standard food for 1 week. They were then maintained on standard food or WD for 5 weeks and Trp (0.25% w/v in water) and B. bifidum were given orally at 100 μL (109 CFU/mouse in PBS) daily. Ahr antagonist, CH-223191, was administered at a dose of 10 mg/kg/day (g) WD animal experimental model design. Comparison of histological NAS calculated from liver tissue (n = 3 per group). (h) Effects of WD and IPA and IAA on liver Tnf-α, Ccl5 and Cxcl10 levels (n = 3 per group).
All data are expressed as mean±SEM. Statistical analysis was performed using post hoc Sidak’s multiple comparisons and one-way ANOVA tests. *p < .05, **p < .01, ***p < .001 as indicated compared to the WD group. #p < .05, ###p < .001 are shown compared to the NC group. Trp, tryptophan; LP, L. plantarum Q180; BB, B. bifidum.
Supplemental material