
Figures & data
*post-hoc p values.
Table 1. Baseline demographic and laboratory data of the study population.
Figure 1. The intestinal fungal microbiome differs significantly between patients with ALD and NAFLD.
(a) Principal coordinate analysis (PCoA) of mycobiome in ALD patients (n = 58), NAFLD patients (n = 78), and controls (n = 34). (b) PCoA of mycobiome in ALD patients (n = 58) and NAFLD patients (n = 78). (c-d) Linear discriminant analysis (LDA) of (c) genera and (d) species of ALD patients vs NAFLD patients. (E-H) Relative abundance of genera (e) Mucor, (f) Kluyveromyces, and of species (g) Candida albicans and (h) Malassezia restricta. A p value of equal or less than 0.05 was considered as statistically significant.
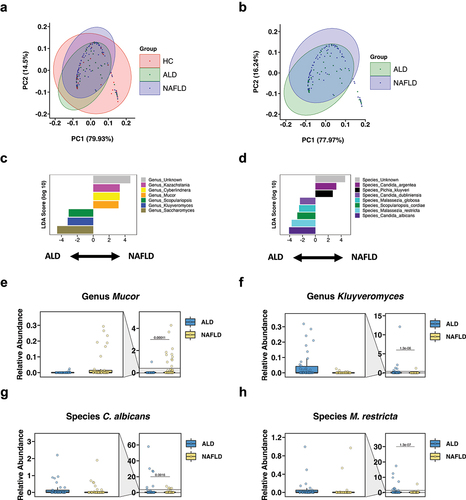
Figure 2. A fungal signature differentiates ALD from NAFLD.
(a-b) Mean decrease accuracy by random forest analysis was quantitated for (a) fungal genera and (b) species to determine their respective feature importance for detecting ALD vs NAFLD. (c) ROC curves of fungal genera and species for detecting ALD vs NAFLD (ALD patients, n = 58; NAFLD patients, n = 78). ALD, alcohol-associated liver disease; AUC, area under the curve; K, Kluyveromyces; M, Mucor; MR, Malassezia restricta; NAFLD, nonalcoholic fatty liver disease; ROC, receiver operating characteristic; SCO, Scopulariopsis/S. cordiae.
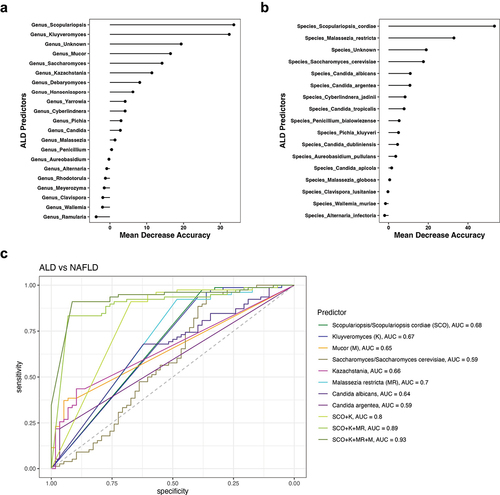
Table 2. ALD vs NAFLD predictors.
*post-hoc p values.
Table 3. Baseline demographic and laboratory data of the study population stratified by fibrosis severity.
Figure 3. Fungal subpopulations distinguish ALD and NAFLD with no or mild fibrosis.
(a-b) Linear discriminant analysis (LDA) of (a) genera and (b) species of ALD F0-F1 vs NAFLD F0-F1. (c-f) Relative abundance of genera (c) Kluyveromyces, (d) Mucor, and of species (e) Candida albicans and (f) Malassezia restricta. (g) ROC curves of fungal genera and species for detecting ALD F0-F1 vs NAFLD F0-F1 (ALD F0-F1 patients, n = 48; NAFLD F0-F1 patients, n = 43). A p value of equal or less than 0.05 was considered as statistically significant. ALD, alcohol-associated liver disease; AUC, area under the curve; K, Kluyveromyces; KAZ, Kazachstania; M, Mucor; MR, Malassezia restricta; NAFLD, nonalcoholic fatty liver disease; ROC, receiver operating characteristic; SCO, Scopulariopsis/S. cordiae.
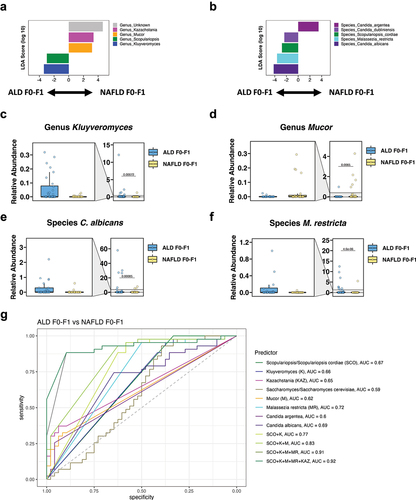
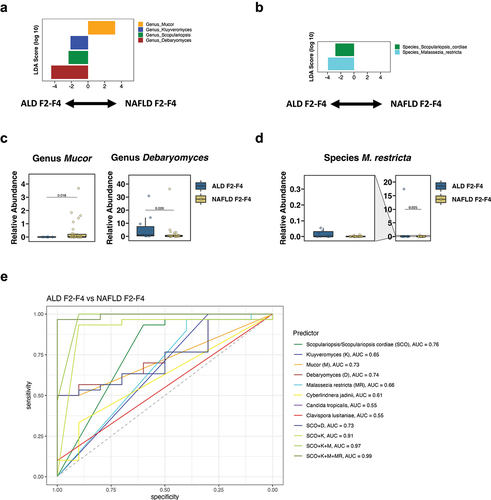
Figure 4. A fungal signature differentiates ALD from NAFLD with significant fibrosis.
(a-b) Linear discriminant analysis (LDA) of (a) genera and (b) species of ALD F2-F4 vs NAFLD F2-F4. (c-d) Relative abundance of genera (c) Mucor and Debaryomyces, and of species (d) Malassezia restricta. (e) ROC curves of fungal genera and species for detecting ALD F2-F4 vs NAFLD F2-F4 (ALD F2-F4 patients, n = 10; NAFLD F2-F4 patients, n = 30). A p value of equal or less than 0.05 was considered as statistically significant. ALD, alcohol-associated liver disease; AUC, area under the curve; K, Kluyveromyces; M, Mucor; MR, Malassezia restricta; NAFLD, nonalcoholic fatty liver disease; ROC, receiver operating characteristic; SCO, Scopulariopsis/S. cordiae.
Supplemental material