
Figures & data
Figure 1. A type 2 secretion system is present and functional in C. rodentium. (a) A complete T2SS operon is present in the C. rodentium genome and 4 predicted effector proteins are located in close proximity to the operon (colored red and grey respectively). (b) Selected T2SS gene expression changes calculated in C. rodentium cultured in DMEM for 3 hours using a ΔΔCt method with dnaQ and C. rodentium grown in LB media used as reference. n = 4, Wilcoxon signed-rank test, error bars are standard error of the mean. (c) Growth dynamics of wild-type (WT) or T2SS knock-out (ΔgspK) strain in LB measured by optical density of the culture. n = 3, error bars are standard deviation. (d) Protein secretion assay showing secretion of putative effector proteins in the WT and ∆gspK strains. Western blot detection of C-terminally V5-tagged ROD_44811 and ROD_44831 proteins expressed ectopically in WT and ∆gspK strains. Ponceau staining for BSA shown to demonstrate equal loading. n = 3 independent experiments, representative blots shown.
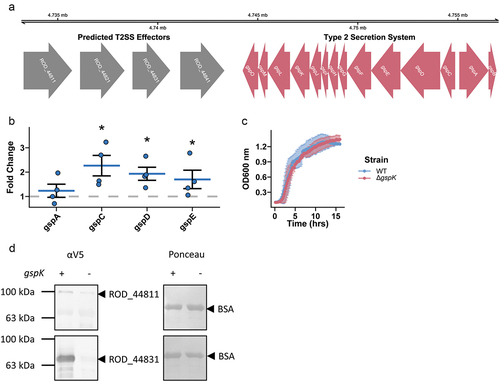
Figure 2. C. rodentium T2SS is necessary for successful infection in C57BL/6J mice. (a) C. rodentium shedding was assessed by CFU enumeration from feces shed daily post- infection and normalized to fecal weight. (b) Mucosal and lumenal sub-populations of C. rodentium in the cecum, ileum, and colon were measured by plating either the lumenal contents or the mucosal tissues on MacConkey agar and counting colony-forming units (CFU). At least n = 5 mice per group, Wilcoxon signed-rank test. (c,d) Hyperplasia was determined by either measuring the crypt length in (C) hematoxylin and eosin (H&E) stained murine intestinal samples or (D) by calculating the proportion of Ki67-positive epithelial (CDH1-positive) cells (as determined by immunofluorescent staining). There were at least n = 5 mice per group and a minimum of 30 crypts were measured per H&E-stained tissue section. (e,f) Systemic spread was assessed by measuring spleen colonization (E) and spleen weight (splenomegaly) (F). * - p < .05, ** - p < .01, *** - p < .001, **** - p < .0001. Wilcoxon signed-rank test.
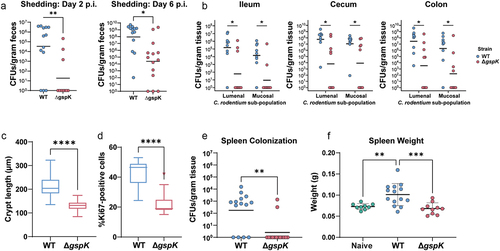
Figure 3. C. rodentium T2SS is necessary for successful infection in C3H/HeJ mice. (a) Weight loss post-infection in WT and T2SS-deficient strains, presented as a proportion of weight (g) measured before C. rodentium infection. n = 5 for each group, error bars indicate standard deviation. (b) Bacterial load of C. rodentium shed in the feces post-infection as determined by selective plating and counting CFU. n = 5 for each group, error bars indicate standard deviation. (c) Probability of survival represents the proportion of mice that have not reached the pre-determined humane endpoints with regards to infection symptoms. n = 5 for each group. Probability of survival in WT- and ΔgspK-infected mice was compared using the log rank test.
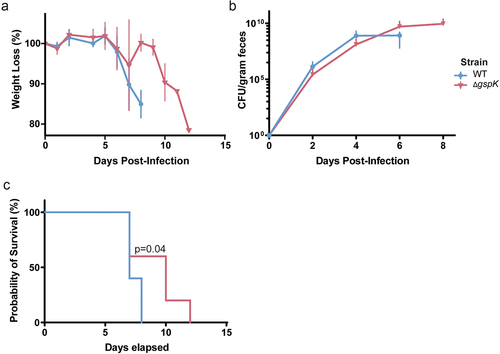
Figure 4. C. rodentium T2SS enables mucin degradation. (a) A network of association of the predicted T2SS effectors. A node-to-node connection indicates that the strength of association has passed a threshold confidence of 0.4 based on STRING analysis. Nodes are coloured based on the gene belonging to one of the statistically enriched pfam protein domains: magenta for “glycosyl hydrolases family 18”, olive for “glycerophosphoryl diester phosphodiesterase family”, brown for “pertactin”, and grey for not being enriched. (b) Lollipop plot showing significantly enriched domains among the predicted effectors. FDR is false discovery rate. (c) Selected T2SS gene expression changes calculated in C. rodentium cultured for 3 hours in either fresh DMEM or DMEM obtained following 2 days of HT-29-MTX culture using dnaQ and C. rodentium grown in LB media as reference. n = 4, Wilcoxon signed-rank test, error bars represent standard error of the mean. (d) Competitive index (CI) calculated via co-infection of intestinal epithelial cell line HT-29-MTX with either chloramphenicol-resistant isogenic WT, ΔgspK, or ΔgspK:gspK C. rodentium strains and WT C. rodentium. CI is indicative of the proportion of adherent bacteria belonging to each strain following a 4-hour infection period compared to the corresponding ratio of strains in the inoculating population. Kruskal-Wallis test followed by Dunn’s multiple comparisons test. n = 6.
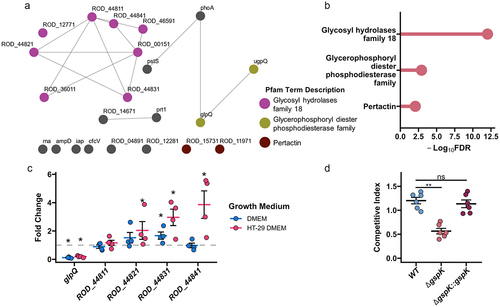
Table 1. Putative T2SS substrates in C. rodentium.
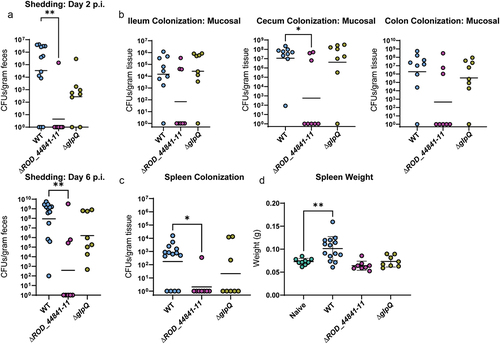
Figure 5. Individual T2SS effectors aid successful infection in C57BL/6J mice. WT-infected mice in this panel are the same mice as WT-infected mice in . (a) C. rodentium shedding was assessed by CFU enumeration from feces and normalized to fecal weight. Kruskal-Wallis test followed by Dunn’s multiple comparisons. (b) Mucosal sub-populations of C. rodentium in cecum, ileum, and colon were measured by plating the mucosal tissue on MacConkey agar and counting CFU. Kruskal-Wallis test followed by Dunn’s multiple comparisons. (c) Systemic spread was assessed by measuring spleen weight (splenomegaly) and spleen colonization. * - p < .05, ** - p < .01. These comparisons were assessed with ANOVA and Dunnett’s multiple comparisons test.
Citro_T2SS_Supplemental figures_revised.docx
Download MS Word (32 MB)Data availability statement
The authors confirm that the data supporting the findings of this study are available within the article [and/or] its supplementary materials. Raw 16S sequence data from mouse fecal samples have been deposited in the NCBI SRA database with the accession number (PRJNA949387).