
Figures & data
Figure 1. Gut microbiome population differs between controls and SCI sub-acute and chronic patients.
a. Scheme showing the number and groups of cohort participants. b. Longitudinal sampling (n = 50) in the sub-acute SCI group plotted against days from the spinal cord damage or accident. Each row corresponds to a sub-acute SCI patient, with circles representing samples and triangles representing discharge time. Circles are colored by ASIA score. c. Unweighted UniFrac PCoA plot of all 100 16S microbiome fecal samples, colored by group (controls, sub-acute, and chronic SCI patients). Histograms show the distribution of samples and groups against PC1 and PC2 values. d. Boxplots of PC1 (left) and PC2 (right) values from stratified by group. ***p < 0.001, Mann–Whitney test. e. Bar plot of per-sample bacterial relative abundance at the phyla level. Only the top four phyla are shown, and the rest are marked as “Other”. For the longitudinal sub-acute samples, only the first and last samples are shown per patient.
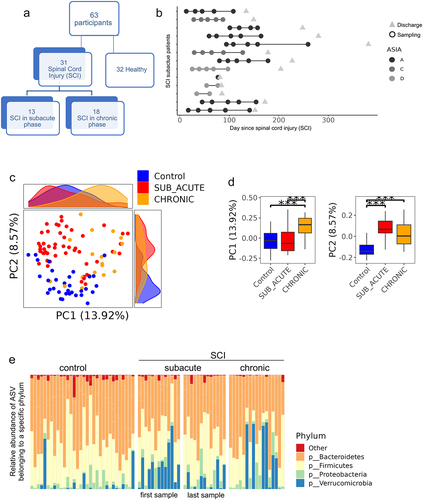
Table 1. Cohort demographics and characteristics at study entry.
Figure 2. Alpha diversity and health index changes in SCI.
a. Boxplot of alpha diversity values, using Faith’s phylogenetic diversity, between control, sub-acute, and chronic SCI patients. Only the first and last samples were used for the longitudinal sub-acute samples, to avoid a within-patient bias. b. Boxplot of our previously defined health indexCitation29 between control, sub-acute, and chronic SCI patients. Again, only the first and last samples were used for the longitudinal sub-acute samples, to avoid a within-patient bias. ***p < 0.001, Mann–Whitney test. Total n is shown in brackets.
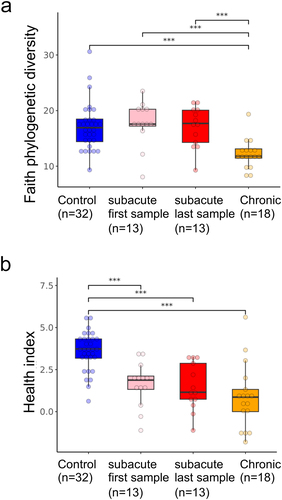
Figure 3. Time from spinal cord damage influences the gut microbiome.
a. PERMANOVA analysis of microbial variation explained by metadata, run separately for the first sample of all subjects, and for the first and last sample within SCI patients, to avoid a within-subject bias. Statistical significance is marked. Variance is estimated for each feature independently while accounting for age and gender (see Methods section). Total n is shown in brackets. b. Heatmap showing the 169 ASVs significantly different between controls and SCI patients, while controlling for age, gender, and subject, using all 100 samples. Each row represents an ASV and each column a sample. Samples are stratified by group and ordered by time from the accident, showing a shift in the longitudinal sub-acute samples into a state more similar to chronic patients. c. Bar plot showing the top 10 increasing and top 10 decreasing ASVs between controls and SCI patients from B. Samples are stratified by group and ordered by days from injury. Relative abundance (RA) values were multiplied by 10,000 to enable the use of a log scale. d. Ridgeline plot showing the distribution of SCI-associated PC1 values between the different groups. PC1 values were extracted from the Unweighted UniFrac-based PCoA calculated on the SCI-associated 169 ASVs from . Groups include control, chronic SCI, and sub-acute SCI, where the longitudinal sub-acute SCI group samples were stratified into four quartiles by time since the accident. *q < 0.05, **q < 0.01, ***q < 0.001, Mann–Whitney test with Benjamini – Hochberg FDR correction. E. Scatter plot of the same PC1 values from against the number of days since the accident, within the 50 longitudinal sub-acute SCI samples, colored by subject, with a linear regression fitting.
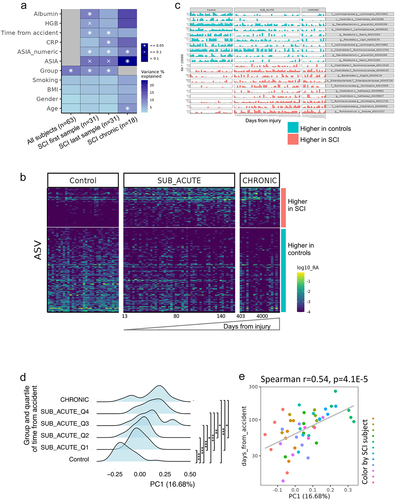
Figure 4. Longer time from the spinal cord damage in the sub-acute group linked with bacteria increased in chronic SCI.
X and Y axes represent the mean relative abundances of each ASV in the chronic and control groups (above and below the slope line respectively). Shown are ASVs significantly positively and negatively correlated to time from injury in the sub-acute patient group (blue and red colors respectively), using Spearman correlation (FDR = 0.25). Most of the ASVs increasing during the sub-acute SCI phase are also higher in the chronic group compared to healthy controls, whilst ASVs decreasing in the sub-acute phase are higher in healthy controls over the chronic SCI group (above and below the slope respectively, two-sided binomial test p-value <4e-8).
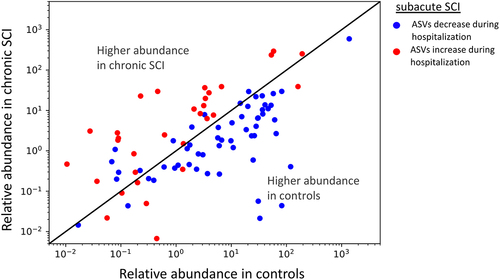
Figure 5. Similarities between bacteria associated with SCI, physical activity and stool consistency.
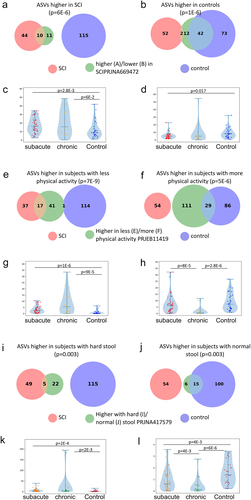
a. Overlap between ASVs significantly higher in SCI in our study (red circle), ASVs significantly higher in healthy controls (blue circle), and ASVs significantly higher in SCI compared to controls in a previously published Chinese cohortCitation32 (green circle, dbBact annotation ID 7428), showing similar SCI disease signals (Fisher exact’s p-value <6e-6). b. Similarly to 5A (red and blue circles remained as 5A) but comparing to ASVs significantly lower in SCI compared to controls in the mentioned Chinese cohort (green circle, dbBact annotation ID 7427), showing consistent healthy control signal (Fisher exact’s p-value <1e-6). c. Per sample distribution of the weighted dbBactCitation27 F-score for the term “higher in spinal cord injury” across the three cohort sub-groups (Distribution lines representing min median and max for each subgroup) showing that the bacterial composition of healthy controls from our study are less associated with SCI bacteria identified in the previous Chinese cohortCitation32 (Horizontal bars denote significant differences between groups with mentioned p-values by nonparametric Mann-Whitney tests). d. Similarly to 5C, but comparing F-score for the term “lower in spinal cord injury”. The bacterial composition of healthy controls from our study is more associated with control bacteria identified in the previous Chinese cohortCitation32 e-h. Similar to 5A-D but comparing to bacteria positively/negatively associated with self-reported physical activity in the American Gut ProjectCitation33(dbBact annotation IDs 1726 and 1725 respectively), showing microbial associations between SCI to lower self-reported physical activity. i-l. Similar to 5A-D but comparing to bacteria positively/negatively associated with normal/hard stool consistency in the Colombian population-based cohort of over-weight adultsCitation28, (dbBact annotation IDs 2918 and 2919 respectively), showing microbial associations between SCI and hard stools.
Supplemental material