
Figures & data
Figure 1. In vivo overexpression of CSC markers in response to CoPEC infection. (a) Western blot analysis of NANOG and OCT-3/4 expression in tumors collected from AOM/DDS-treated mice infected with the 11G5 strain or the 11G5Δpks strain. Bar graphs on the right represent quantification of bands density using ImageJ software. Values represent means ± SEM; *p < .05. (b) OCT-3/4 and NANOG mRNA levels in the human non-tumoral colonic mucosa colonized by CoPEC (pks+) (N = 30), or by E. coli that did not carry the pks island (pks-) (N = 39), were quantified using qRT-PCR. Medians are represented on the graph; *p < .05. (c) Expression of OCT-3/4 in colonic tumors colonized by CoPEC (pks+) (N = 6), or by E. coli that did not carry the pks island (pks-) (N = 9), was analysed using Western blot. The graph represents the quantification of band intensity using the Image Lab Software from Bio-Rad; *p < .05.
Figure 2. Human colon cancer cells made senescent by 11G5 growth at 3 weeks post-infection and are more resistant to chemotherapeutic drugs both in vitro and in a xenograft mouse model. (a-c) HT-29 cells were infected with the 11G5 strain or the 11G5Δpks strain, and 3-week post-infection cells were used. (a) Representative pictures of 11G5-infected cells at 3 weeks post-infection. (b) Cells were trypsinized, seeded on 96-well plates, and exposed to various doses of chemotherapeutic drugs for 1 week. Cellular viability was assessed by MTT assay. Untreated cells were used to represent 100% viability. Data are means ± SEM of eight replicates and are representative of three independent experiments. *p < .05; **p < .005; ***p < .001. (c) Three weeks post-infection, 10Citation6 cells were subcutaneously injected into the dorsal flaps of 5-week-old nude mice. Seven days post-engraftment, mice received 30 mg/kg of 5-FU twice weekly for 3 weeks. Tumor sizes were measured using a caliper twice weekly. N = 6 mice/group. Data are means ± SEM. NS, not significant; *p < .05; ***p < .001; ****p < .0001.
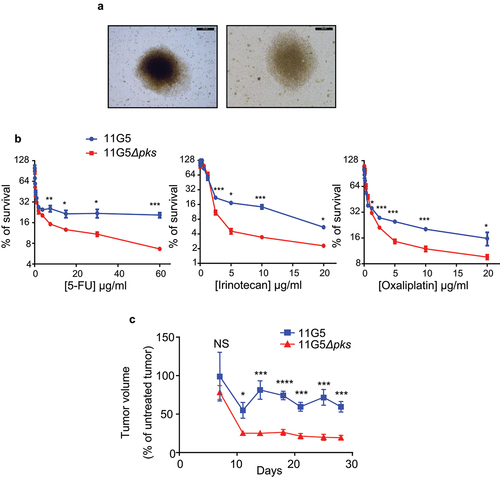
Figure 3. Human colon cancer cells made senescent by 11G5 exhibited rebound growth and features of CSCs at 3 weeks post-infection. (a–c) HT-29 cells were infected with the 11G5 strain or the 11G5Δpks strain, and 3-week post-infection cells were used. (a) Cells were trypsinized and seeded on ultra-low attachment plates in the presence or absence of EGF and FGF. Representative pictures are shown. (b) Cells were trypsinized and seeded in a culture medium with 0.7% soft agar. After 2 weeks, colonies were counted (bar graph). Representative pictures are shown to the right of the bar graph. Values represent means ± SEM; ****p < .0001. (c) Cells were incubated with a substrate of alkaline phosphatase. A brown color signaled substrate degradation by the alkaline phosphatase. Representative pictures are shown.
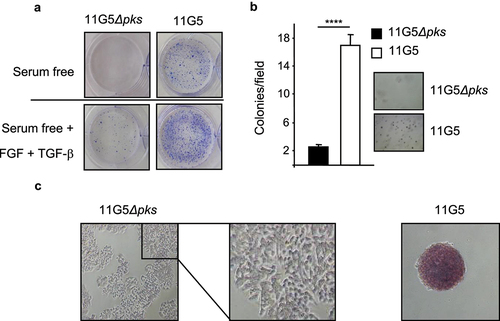
Figure 4. 11G5 infection of human colon cancer cells fostered the emergence of cells expressing CSC and EMT markers at 3 weeks post-infection. (a–d) cells were infected with the 11G5 strain or the 11G5Δpks strain, and 3-week post-infection cells were used. (a) Spheroids resulting from 11G5 infection were mechanically disrupted and then stained for the transcription factors involved in cellular reprogramming by immunofluorescence [red (SOX-2 and KLF-4) or green (c-MYC, NANOG, OCT3/4)]. Nuclei were stained with DAPI (blue). (b) Quantification of cells expressing CD133. Values represent means ± SEM; *p < .05. (c) Immunofluorescent labelling of the EMT markers N-cadherin or vimentin (red). Nuclei were stained with DAPI (blue). (d) The EMT marker E-cadherin was analysed using Western blot. Bar graph on the right represents quantification of bands density using ImageJ software. Values represent means ± SEM; *p < .05.
![Figure 4. 11G5 infection of human colon cancer cells fostered the emergence of cells expressing CSC and EMT markers at 3 weeks post-infection. (a–d) cells were infected with the 11G5 strain or the 11G5Δpks strain, and 3-week post-infection cells were used. (a) Spheroids resulting from 11G5 infection were mechanically disrupted and then stained for the transcription factors involved in cellular reprogramming by immunofluorescence [red (SOX-2 and KLF-4) or green (c-MYC, NANOG, OCT3/4)]. Nuclei were stained with DAPI (blue). (b) Quantification of cells expressing CD133. Values represent means ± SEM; *p < .05. (c) Immunofluorescent labelling of the EMT markers N-cadherin or vimentin (red). Nuclei were stained with DAPI (blue). (d) The EMT marker E-cadherin was analysed using Western blot. Bar graph on the right represents quantification of bands density using ImageJ software. Values represent means ± SEM; *p < .05.](/cms/asset/0ff0cb21-7c9e-4a50-a60f-9c06cca867f6/kgmi_a_2310215_f0004_oc.jpg)
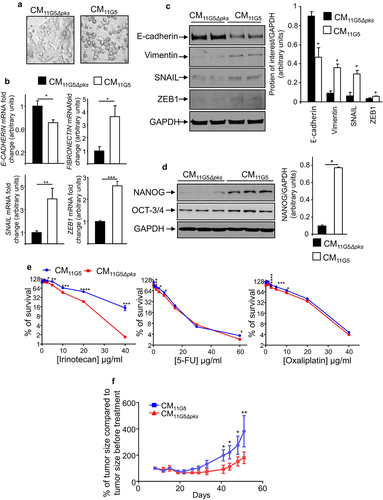
Figure 5. The SASP induced by 11G5 infection promoted the expression of CSC and EMT markers leading to chemoresistance in non-infected human colon cancer cells. (a–f) Cells were infected with the 11G5 strain or the 11G5Δpks strain. Five days post-infection, conditioned media (CM) derived from infected cells were collected and used to culture uninfected cells for 3 days (panel B), 5 days (panels A, C, D, F), 7 days (panel E). CM11G5, CM derived from 11G5-infected cells; CM11G5Δpks, CM derived from 11G5Δpks-infected cells. (a) Representative picture of cells incubated with the indicated CM. (b) E-cadherin, fibronectin, SNAIL, and ZEB1 mRNA levels were quantified using qRT-PCR. Values represent means ± SEM. *p < .05; **p < .01; ***p < 0.001. (c) EMT and (d) the NANOG CSC markers were analysed using Western blot. Bar graphs on the right represent quantification of bands density using ImageJ software. Values represent means ± SEM; *p < .05. (e) Uninfected cells were cultured for 1 week with the indicated CM supplemented with various concentrations of chemotherapeutic drugs. Cell viability was assessed using MTT assay. Untreated cells were used to represent 100% viability. Values represent means ± SEM. *p < .05; **p < .01; ***p < .001; ***p < .0001. (f) After 5 days of culture in the presence of the indicated CM, 106 HT-29 cells were subcutaneously injected into the dorsal flaps of 5-week-old nude mice. 7 days post-engraftment, mice received 30 mg/kg of irinotecan twice weekly for 3 weeks. Tumor sizes were measured using a caliper twice weekly. N = 6 mice for CM11G5 group and N = 5 mice for CM11G5Δpks group. Data are means ± SEM. *p < .05; **p < .01.
Supplemental Figures revised version.docx
Download MS Word (256.8 KB)supplementary_data.docx
Download MS Word (12.8 KB)Data availability statement
The data that support the findings of this study are available from the corresponding author, GD, upon reasonable request.