
Figures & data
Figure 1. TAC-induced disturbance of glucose homeostasis. a body weight of mice over 4 weeks. b fasting blood glucose. c intraperitoneal glucose tolerance test (GTT). d area under the curve (AUC) for the GTT curves. e HbA1c. f intraperitoneal insulin tolerance test (ITT). g area under the curve (AUC) for the ITT curves. h fasting serum insulin. i HOMA-R index. Data are presented as the mean± SD (n = 6 biologically independent animals). *p<.05, **p<.01, ***p<.001 verse control group, #p<.05, ##p<.01, ###p<.001, ####p<.0001 verse TAC group.
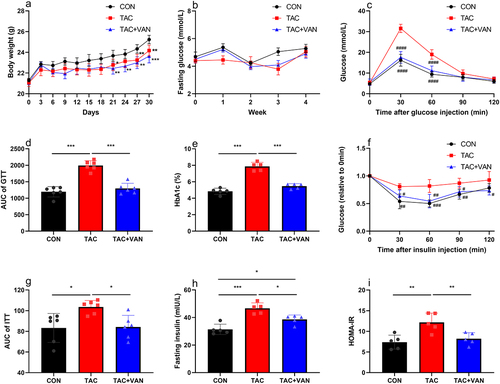
Figure 2. Vancomycin prevention of TAC-induced insulin and glucagon secretion dysfunction. a Histological analysis of β cell proliferation in the pancreatic tissues of mice. (magnification 40×, scale bar = 50 μm). b Representative image of an islet immunostained for glucagon and insulin. Scale bar = 100 μm. c quantification of α cells and β cells per islet slice, and the ratio of β cells and α cells. Data are presented as the mean± SD (n = 3 biologically independent animals). *p < .05, **p < .01, ***p < .001.
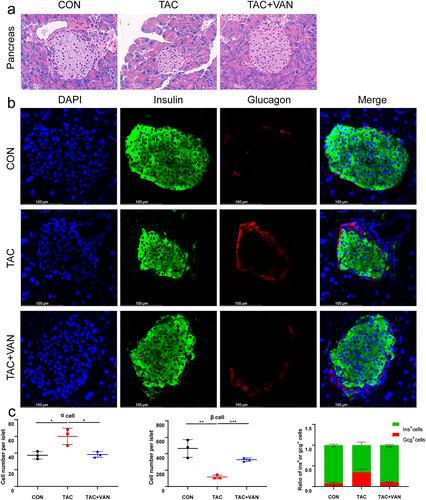
Figure 3. Taxonomic composition of the gut microbiota of mice. a Venn diagram of the composition of gut microbiota in the three groups. b analysis of the differential number of genes. c Principal component analysis (PCA) at phylum level. d composition summary showing the top 10 phyla detected in the gut microbiota. e Cladograms generated by LEfSe depicting taxonomic associations among the three groups of mice microbial communities. f an LDA score based on the LEfSe method is shown and highlights the taxonomic groups in the CON, TAC and TAC+VAN group. Red bars indicate taxa predominant in CON mice. Green bars indicate taxa predominant in TAC mice. Blue bars indicate taxa predominant in TAC+VAN mice (LDA >3). Data are presented as the mean± SD (n = 6 biologically independent animals). *p<.05, **p<.01, ***p<.001.
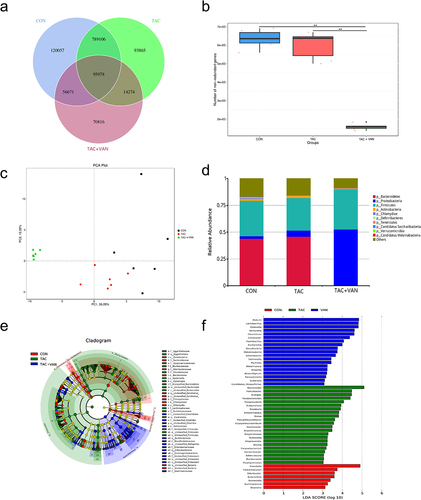
Figure 4. GUS-producing species are enriched in TAC-induced PTDM mouse model. a OPLS-DA plot on species level in the three groups. b the species rank of VIP scores of the OPLS-DA analysis between CON and TAC groups. c different species abundance of GUS producing bacteria based on metagenomic data. Data are presented as the mean± SD (n = 6 biologically independent animals). *p<.05, **p<.01, ***p<.001.
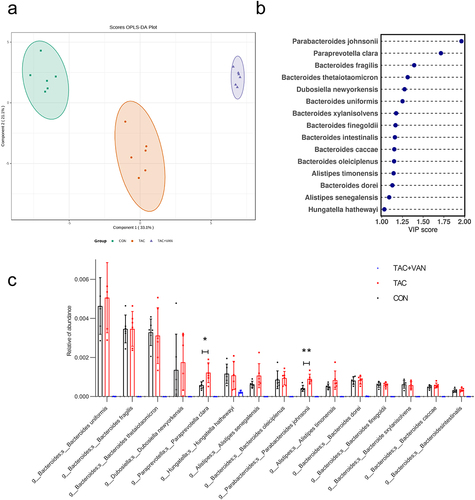
Figure 5. Vancomycin inhibited GUS gene expression up-regulated by TAC. a KEGG pathway classification in three groups. b CAZy category. (GH, Glycosyl Hydrolases; GT, Glycosyl Transferase; CBM, carbohydrate-binding Modules; CE, carbohydrate Esterases; AA, auxiliary activities). c relative abundance of genes encoding carbohydrate enzymes at CAZyme level 2. d clustering heat maps of CAZy families. e gene abundance of the GH family, to which the GUS enzymes belong. g GUSB gene expression in feces by qPCR. Data are presented as mean± SD (n = 6 biologically independent animals). *p<.05, **p<.01, ***p<.001.
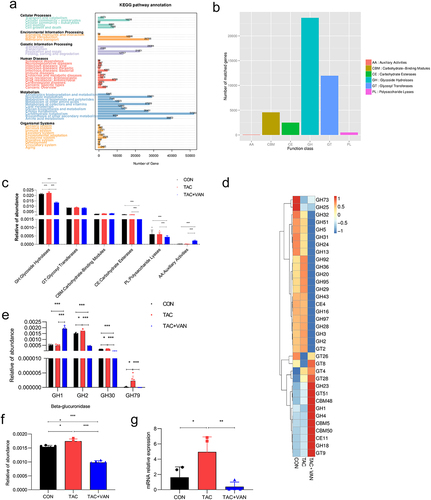
Figure 6. Vancomycin inhibited intestinal bacterial GUS activity. a GUS activity of the CON, TAC and TAC+VAN group was then imaged using the fluorescent substrate FDGlcU. b mean fluorescence intensity of the three groups. c fecal pellets were collected to evaluate the GUS activity in mice by pNPG assay. d concentration of GUS in fecal were determined by ELISA. Data are presented as the mean± SD (n = 6 biologically independent animals). *p<.05, **p<.01, ***p<.001.
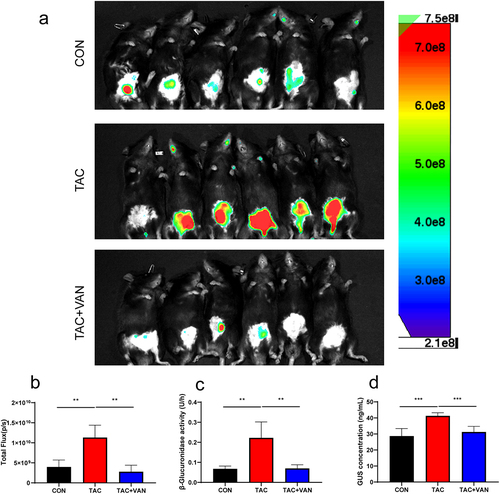
Figure 7. SCFAs and BAs levels. a quantification of the level of different SCFA in the fecal content. b, c primary and secondary bile acid levels in the serum and liver (n = 6 biologically independent animals). d FXR and TGR5 protein expression in the ileum were detected by western blot. e expression of CYP7A1 and SHP1 in liver were detected by western blot. f serum FGF15 levels were detected by ELISA. Data are presented as the mean± SD (n = 3 biologically independent animals). *p<.05, **p<.01, ***p<.001.
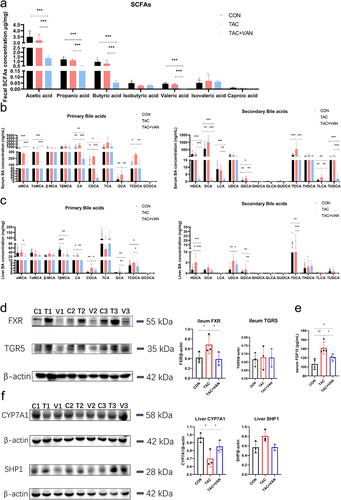
Figure 8. GUS-producing bacteria are significantly correlated with BAs profile. Heatmap of spearman’s correlation coefficients between the serum (a) and liver BAs (b) and the GUS-producing bacteria, the color of each spot in the heatmap corresponds to the r value (ρ>.6). The correlations were analyzed using Spearman’s correlation. FDR-adjusted p < 0.05 (*p < 0.05, **p < .01, ***p < .001) was shown.
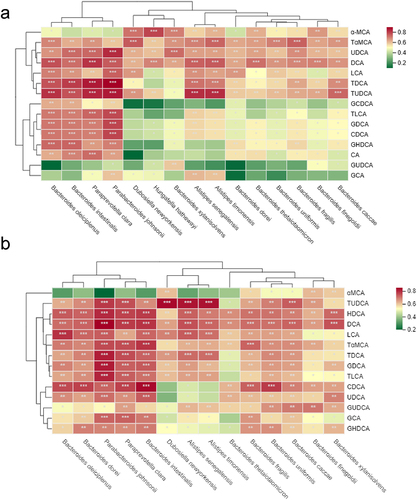
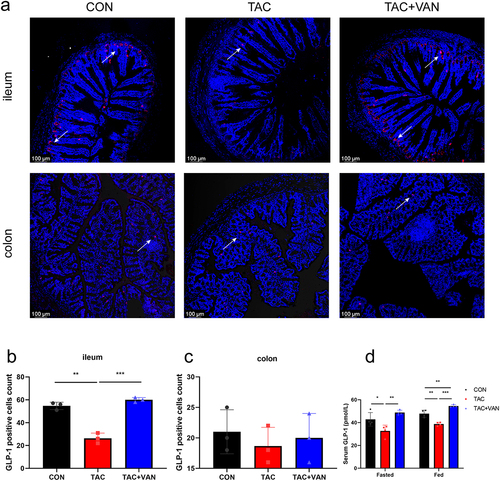
Figure 9. Effects of vancomycin on the protein expression of GLP-1 in the ileum and colon. A Representative photographs of ileum and colon sections stained with an anti-GLP-1 antibody. The blue fluorescence indicates DAPI, and the red fluorescence indicates GLP-1. (a: 200 × objective, scale bar = 100 μm). b, c quantitation of GLP-1 cell numbers per field of ileal and colonic tissue. d serum level of GLP-1 after fasting or 30 min after an injection of glucose. Data are presented as the mean± SD (n = 3 biologically independent animals). *p < .05, **p < .01, ***p < .001.
Supplemental Material
Download Zip (5.1 MB)Data availability statement
The datasets used and analyzed during the current study are available from the corresponding author on reasonable request.