
Figures & data
Figure 1. Progression of CP in a caerulein-induced mouse model: (a) schematic of caerulein administration for developing a mouse model of CP and treatment with opioids to understand their effect on CP. (b) Pancreas to mouse weight ratio at 6th and 11th week as compared to control group. (c) Representative H &E and Sirius red stain of control, 6W CP and 11W CP mice. Pancreases revealed increased atrophy and collagen deposition with increased duration of caerulein treatment. Histological representation of pancreas atrophy (d) and percent of Sirius red stained area in mice pancreas. (e) Data were analyzed by t-tests (two-tail). ***p < .001. Data are represented as mean ± SD.
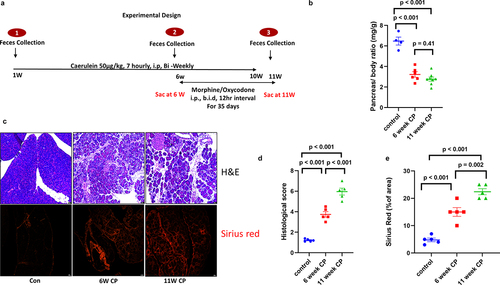
Figure 2. Diversity and composition analysis of the fecal microbiome samples. Samples are grouped by 0-week control (n = 9), 6-week CP (n = 9) and 11-week CP (n = 9). (a) Principal coordinates analysis (PCoA) plot of Jaccard distance (metrics of β -diversity). P-value <.001 between any two groups. (b) PCoA plot of Bray-Curtis distance (metrics of β -diversity). P-value < .001 between any two groups. (c) Chao11 index (metrics of α-diversity). Error bars represent SEM. P-value = .034 between 0-week and 6-week CP. P-value = .001 between 0-week and 11-week CP. P-value = .003 between 6-week and 11-week CP. (d) LefSeSe (linear discriminant analysis effect size) analysis of top discriminative bacteria species between samples from 0-week control, 6-week CP, and 11-week CP. LDA threshold > 3.0.
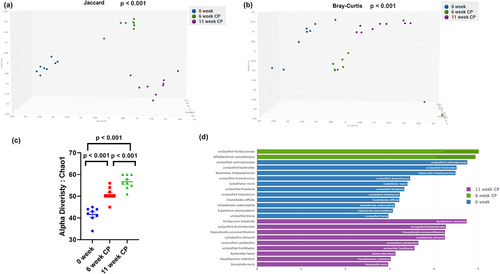
Figure 3. Opioid treatment after induction of CP causes increased pancreatic atrophy, inflammation, and fibrosis: (a) pancreas to mouse weight ratio shows a significant reduction in CP and CP + opioid groups compared to control. CP + MOR groups showed further significant reduction of pancreas to mouse weight ratio compared to CP group. (b) Representative H&E and Sirius red stain of control, 11W CP, 11W CP + MOR, and 11W CP + OXY mice pancreases revealed increased atrophy and collagen deposition in CP and opioid-treated CP mice group. Histologic score of pancreatic atrophy in different groups (c) and percent of Sirius red stained area in mice pancreas (d). Data were analyzed by t-tests (two-tail). ***p< .001. Data are represented as mean ± SD, with n = 8 in each group. (e) Western blots showed the expression of a-Amylase, a-SMA and beta- tubulin in control, 11W CP, 11W CP+MOR, pancreatic tissue.
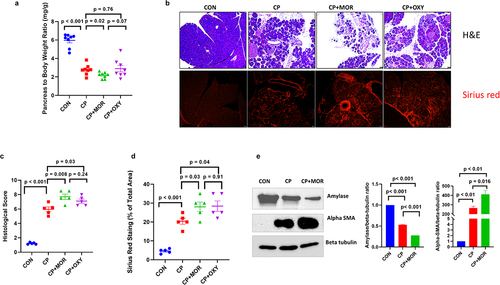
Figure 4. Morphine increased thermal and mechanical pain sensitivities in caerulein-induced CP mice: (a) thermal pain sensitivity was measured by tail flick test from week 7 to week 10. (b) Thermal pain sensitivity at week 9. (c) Thermal pain sensitivity at week 10. (d) Mechanical pain sensitivity was measured by Randall-Selitto test from week 7 to week 10. (e) Mechanical pain sensitivity at week 9. (f) Mechanical pain sensitivity at week 10.
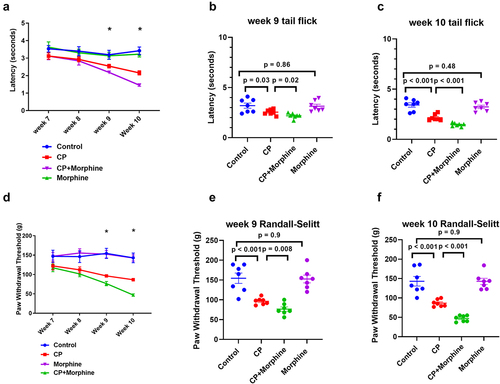
Figure 5. Diversity and composition analysis of fecal microbiome samples. Samples are grouped by 11-week control (n = 9), 11-week CP (n = 9), 11-week CP + morphine (n = 9), and 11-week morphine (n = 9). (a) PCoA plot of Jaccard distance (metrics of β -diversity) in all groups. P-value < .01 between any two groups. (b) PCoA plot of Bray-Curtis distance (metrics of β -diversity) in all groups. P-value < .01 between any two groups. (c) PCoA plot of Jaccard distance (metrics of β -diversity) in 11-week CP and 11-week CP + morphine. P-value < .01 between 11-week CP and 11-week CP + morphine. (d) PCoA plot of Bray-Curtis distance (metrics of β -diversity) in 1- week CP and 11-week CP + morphine. P-value < .01 between 11-week CP and 11-week CP + morphine. (e) Chao11 index (metrics of α-diversity). Error bars represent SEM. P-value < .001 between 11-week control and 11-week CP, 11-week CP + morphine, or 11-week morphine. P-value > .05 between 11-week CP, 11-week CP + morphine, and 11-week morphine. (f) LefSeSe (linear discriminant analysis effect size) analysis of top discriminative bacteria species between 11-week CP and 11-week CP + morphine. LDA threshold > 2. “u s” is short for “unidentified species”.
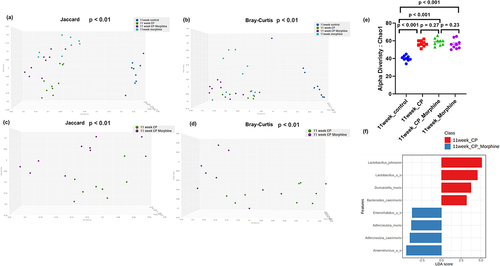
Figure 6. Function pathway analysis of the fecal microbiome samples. Samples are grouped by 11-week control (n = 9), 11-week CP (n = 9), 11-week CP + morphine (n = 9), and 11-week morphine (n = 9). (a) Heatmap of virulence factors in all groups. (b) LefSeSe (linear discriminant analysis effect size) analysis of top discriminative virulence factors between 11-week CP and 11-week CP + morphine. LDA threshold > 2. (c) Heatmap of KEGG pathways in all groups. (d) LefSeSe (linear discriminant analysis effect size) analysis of top discriminative KEGG pathways between 11-week CP and 11-week CP + morphine. LDA threshold > 2.
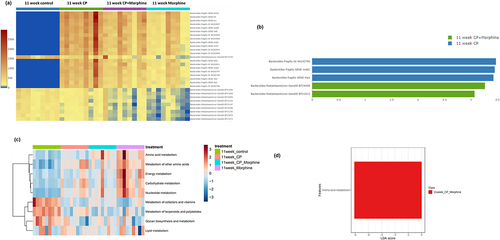
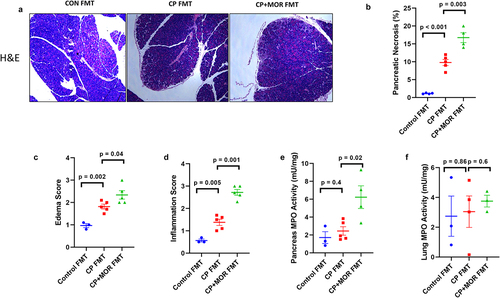
Figure 7. The morphine-induced microbiome sensitized caerulein-induced acute pancreatic inflammation. Germ-free mice were gavaged with control, CP, and CP + MOR mice microbiome followed by suboptimal caerulein challenge. (a) Representative H&E staining of mice pancreas histology of different groups, demonstrating that CP and CP + morphine microbiota sensitize to pancreatic injury at suboptimal caerulein dose (5ug/kg/h) as indicated by increased inflammation and necrosis, when compared with control microbiota gavage mice. Quantification of the ratio of pancreatic necrosis, (b) edema, (c) and infiltrating immune cells (d). MPO activity of pancreases (e and lung extract (f) of caerulein-treated microbiome gavage of germ-free mice. Data were analysed by t tests (two-tail). ***p < .001. Data are represented as mean ± SD, with n = 5 in each group.
Supplemental Material
Download Zip (15.9 MB)Supplemental table_S1toS6.xlsx
Download MS Excel (3.5 MB)Data availability statement
Sequence data were deposited in the Biostudies database (https://www.ebi.ac.uk/biostudies/) under accession number S-BSST1080 (https://www.ebi.ac.uk/biostudies/studies/S-BSST1080).