
Figures & data
Figure 1. The pathological symptoms in remission-achieving colitis mice are alleviated by anti-α4β7-integrin. (a) Changes of weight loss and the ratio of weight loss (n = 7–9); (b) changes of disease activity index score and the disease activity index score at day 7 (n = 7–9); (c) Representative images of colon and related scores of colonic mucosal macro injury (n = 7–9); (d) Representative images at a scale bar of 200 μm and related scores of hematoxylin and eosin-stained colon tissue (n = 4); (e,f) Representative images at scale bars of 50 and 20 μm display CD3 and CD68 immunofluorescence-stained colon tissue (n = 4); (g) real-time quantitative polymerase chain reaction (RT-qPCR) of CD3 and CD68 in colon (n = 4). Mean ± SD are presented. A one-way analysis of variance (ANOVA) was applied. nsp > .05, *p < .05, **p < .01, and ****p < .0001.
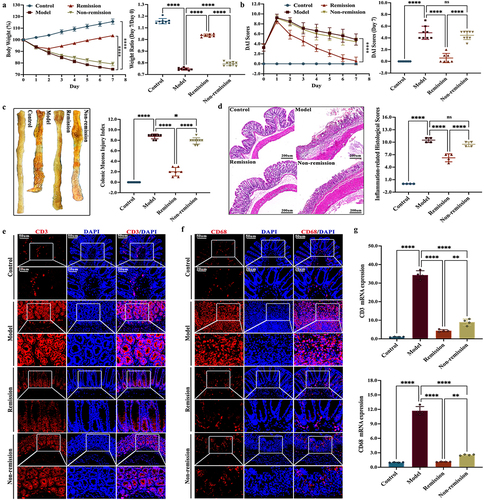
Figure 2. The intestinal inflammation in remission-achieving colitis mice is mitigated by anti-α4β7-integrin. (a) Enzyme-linked immunosorbent assay of inflammatory cytokines in serum (n = 7–9); (b) RT-qPCR of inflammatory cytokines in colon (n = 4); (c) Representative images at scale bars of 100, 50, and 20 μm display MPO immunohistochemistry-stained colon tissue (n = 4); (d) quantification of C (n = 4); (e) RT-qPCR of MPO in colon (n = 4). Mean ± SD are presented. A one-way ANOVA was applied. nsp > .05, **p < .01, ***p < .001, and ****p < .0001.
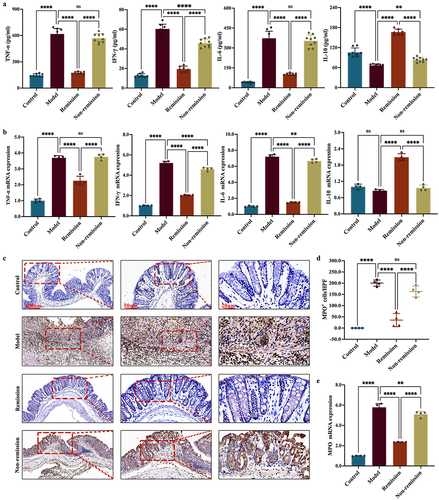
Figure 3. The gut barrier function in remission-achieving colitis mice is restored by anti-α4β7-integrin. (a) RT-qPCR of tight junction (TJ) proteins in colon (n = 4); (b) Representative images at scale bars of 100, 50, and 20 μm display TJ proteins immunofluorescence-stained colon tissue (n = 4); (c) Representative immunoblots of TJ proteins in colon (n = 4). Mean ± SD are presented. A one-way ANOVA was applied. nsp > .05, **p < .01, ***p < .001, and ****p < .0001.
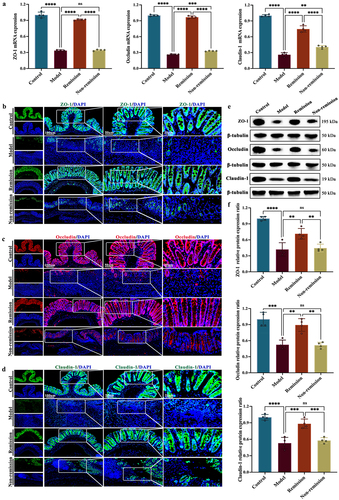
Figure 4. The composition of the gut microbiota at baseline can predict treatment responses in humanized mice with colitis. (a) Principal component analysis (PCA) score plot; (b) Non-metric multidimensional scaling plot; (c) analysis of similarities; (d) pan gene curve; (e) gut microbiota composition at phylum, genus, and species levels; (f,g) gut microbiota composition significantly varied at all levels between the groups in and out of remission; (H) functional enrichment of KEGG at level 1. (n = 3 in each group).
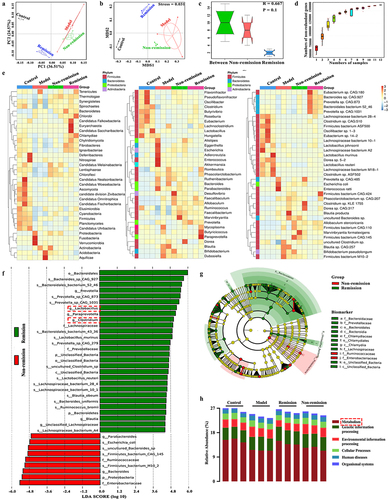
Figure 5. The modulation of metabolism at baseline is involved in treatment responses in humanized mice with colitis. (a) Quality control sample correlation analysis; (B) PCA score plot; (c) sort verification plot; (d) venn diagram of differential groups; (e) volcano plot; (f) loading plot; (g) correlation Sankey diagram; (h) correlation chord diagram; (i) functional enrichment of KEGG at level 2; (j) functional enrichment of KEGG at level EC (n = 6 in each group).
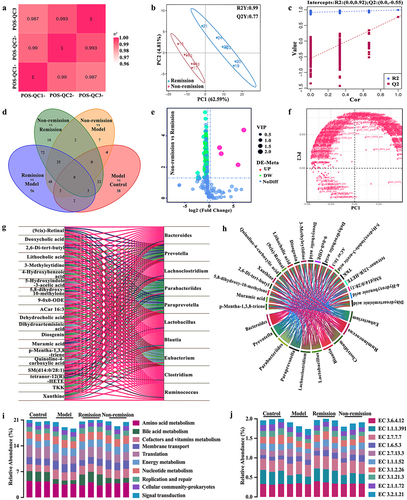
Figure 6. A comprehensive predictive model is constructed by combining baseline data that include gut microbiota and bile acid (BA) metabolism. (a) Differences in the relative abundance of functions related to gut microbiota between groups; (b) predictive model demonstrating area under curve from gut microbiota and BA metabolism; (c) differences in the relative abundance of enzymes related to gut microbiota between the remission group and the non-remission group.
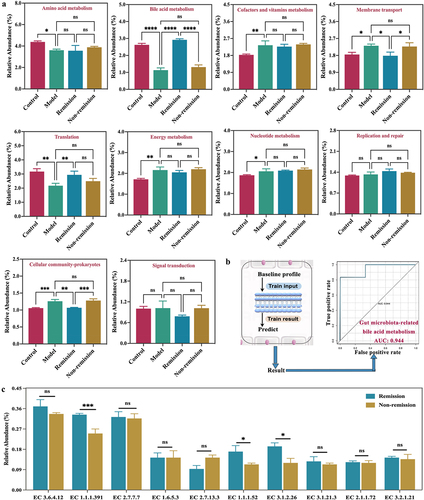
Figure 7. Anti-α4β7 integrin provides sustained therapeutic benefits in clinical remission cases during follow-up. (a) Overall overview of clinical experiments in our study; (b – g) comparisons for biomarker trajectories at individual time points; (h – i) comparisons for clinical score trajectories at individual time points. (n = 3 in each group).
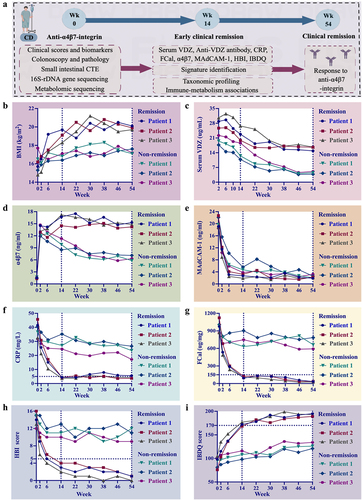
Figure 8. Changes in the examination results of six clinical cases at weeks 0, 14, and 54. (a) Clinical remitter 1; (b) clinical remitter 2; (c) clinical remitter 3; (d) clinical non-remitter 1; (e) clinical non-remitter 2; (f) clinical non-remitter 3.
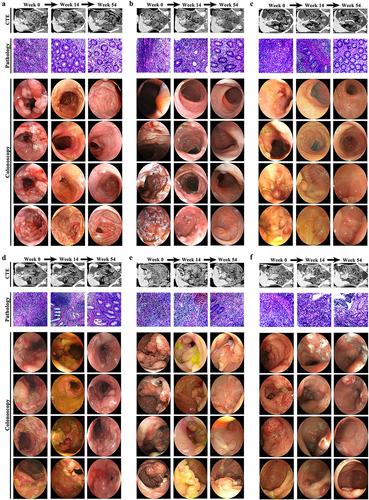
Figure 9. The gut microbiota composition of clinical remitters shows significant persistency. (a, e, and h) PCA score plots at weeks 0, 14, and 54; (b, f, and i) community α-diversity analyses at weeks 0, 14, and 54; (c, g, and j) venn diagrams at weeks 0, 14, and 54; (d, h, and k) gut microbiota composition significantly varied at all levels between the groups in and out of remission at weeks 0, 14, and 54. (n = 3 in each group). Mean ± SD are presented. The student’s t-test was applied. nsp > .05, *p < .05, **p < .01.
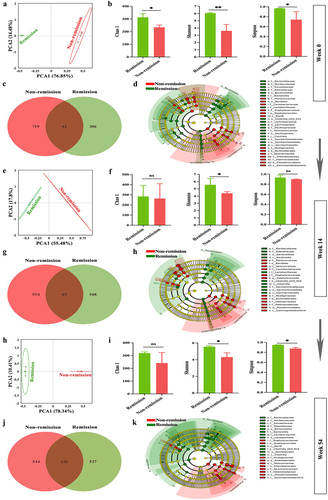
Figure 10. Persistent consistency in gut microbiota composition promotes sustained remission in clinical remitters. (a – c) relative abundance of the top 10 gut microbiota at phylum at weeks 0, 14, and 54; (d – f) relative abundance of the top 10 gut microbiota at genus at weeks 0, 14, and 54; (g-i) relative abundance of the top 10 gut microbiota at species at weeks 0, 14, and 54. (n = 3 in each group).
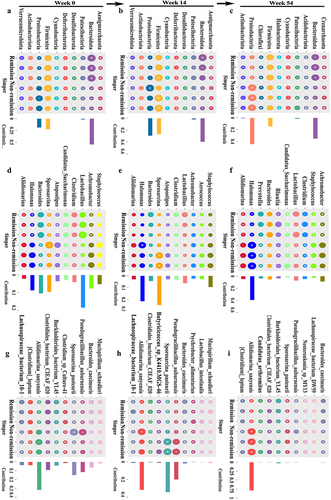
Figure 11. BA metabolomic profiling confirms functional signatures associated with treatment outcomes in clinical cases. (a, d, and g) PCA score plots at weeks 0, 14, and 54; (b, e, and h) comparisons of total primary and secondary BAs between groups at weeks 0, 14, and 54; (c, f, and i) comparisons of 15 BAs between groups at weeks 0, 14, and 54. (n = 3 in each group). Mean ± SD are presented. The student’s t-test was applied. *p < .05, **p < .01, ***p < .001, and ****p < .0001.
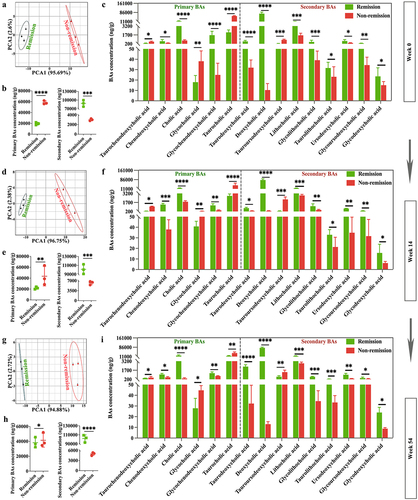
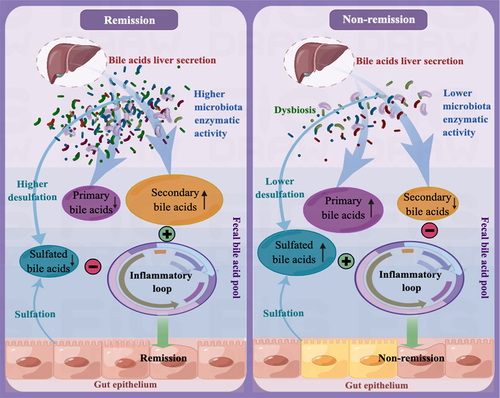
Figure 12. The mechanism that regulates immunotherapy responses to anti-α4β7-integrin in Crohn’s disease. In clinical remitters, higher microbiota enzymatic activity results in a luminal BA pool that primarily consists of secondary BAs and has minimal amounts of primary and 3-OH-sulfated BAs. This specific composition of BAs has a significant positive impact on treatment responses by alleviating intestinal inflammation. Conversely, in clinical non-remitters, lower microbiota enzymatic activity triggers alterations in the composition of the luminal BA pool, increasing sulfated BAs at the expense of secondary BAs. These modifications impair the anti-inflammatory properties of secondary BAs on intestinal epithelial cells, ultimately leading to poor treatment outcomes.
Supplemental Material
Download MS Word (153.4 KB)Data availability statement
The data obtained from whole-genome shotgun metagenomics and 16S-rDNA gene high-throughput sequencing were uploaded to the NCBI SRA (www.ncbi.nlm.nih.gov) and can be accessed using the following BioProject numbers: PRJNA1022859, PRJNA1024074, PRJNA1024099, and PRJNA1024450. The data generated from non-targeted metabolomics and targeted BA metabolomics were deposited in the MetaboLights (www.ebi.ac.uk/metabolights) and can be accessed using the following numbers: MTBLS8700 and MTBLS8702.