
Figures & data
Figure 1. Gut microbiota is involved in host melatonin production.
Figure 2. Melatonin production is regulated by fecal microbiota transplantation.
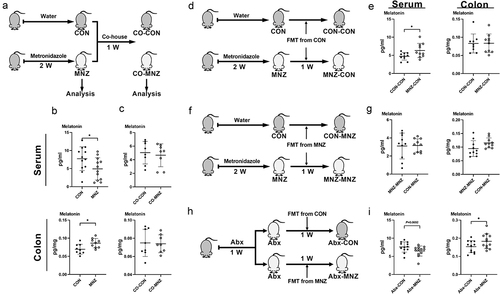
Figure 3. L. R, L. I, L. J or E. coli colonization affects melatonin production in vivo.
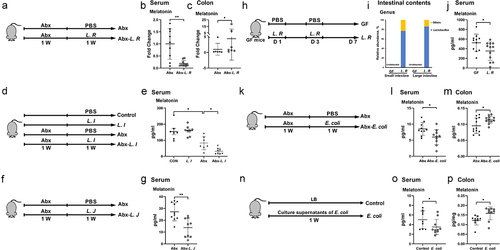
Figure 4. Gut microbiota regulates AANAT expression through NF-κB signaling.
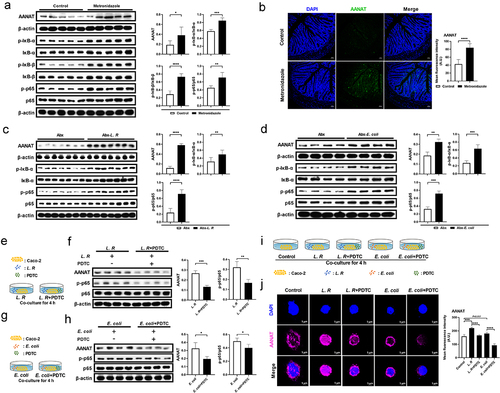
Figure 5. MyD88 deficiency eliminates the effects of metronidazole treatment on melatonin production.
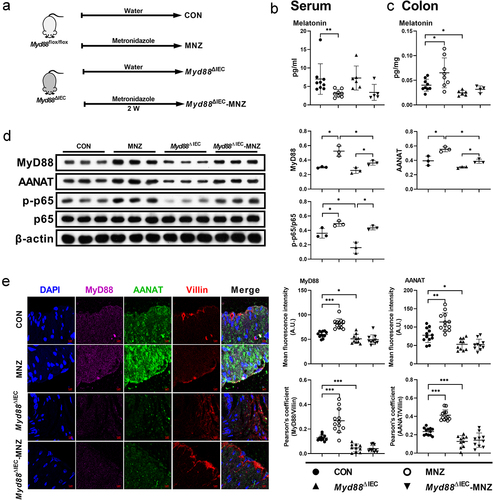
Figure 6. MyD88 deficiency eliminates the effects of L. R or E. coli colonization on melatonin production.
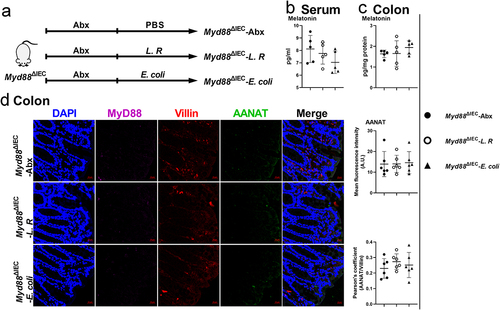
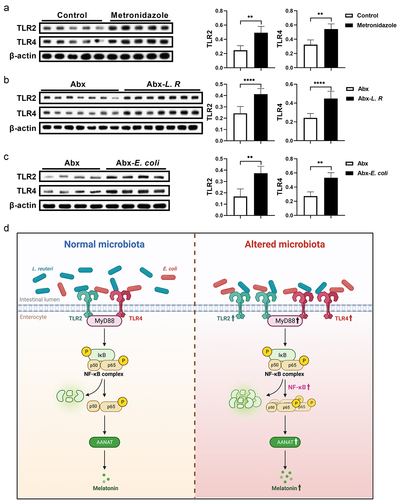
Figure 7. Gut microbiota activates TLR2 and TLR4 signaling in the colon.
Supplemental Material
Download Zip (3 MB)Data availability statement
The raw 16S rDNA sequencing data generated in this study have been deposited in the NCBI Sequence Read Archive (https://www.ncbi.nlm.nih.gov/sra) under the accession number PRJNA1047195.