
Figures & data
Table 1. Primers of qPCR.
Figure 1. Characterization and colonization ability of gastrogenic W. coagulans strains.
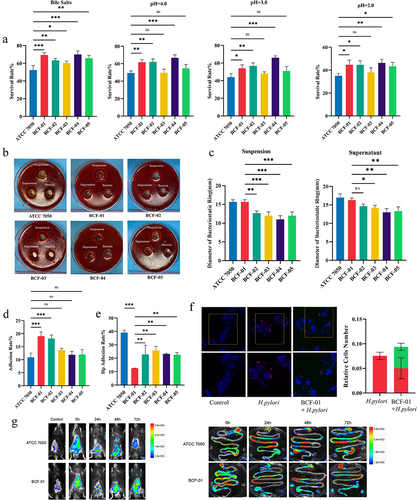
Figure 2. Safety evaluation of gastrogenic W. coagulans BCF-01 in male mice.
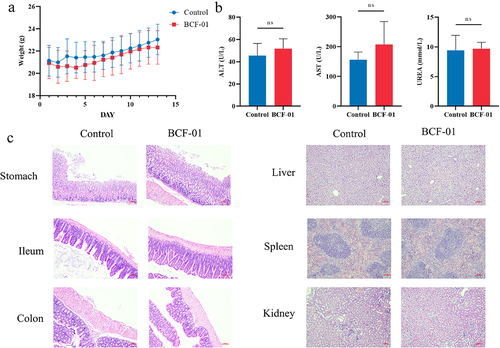
Figure 3. W. coagulans BCF-01 inhibits Hp infection in a mouse model.
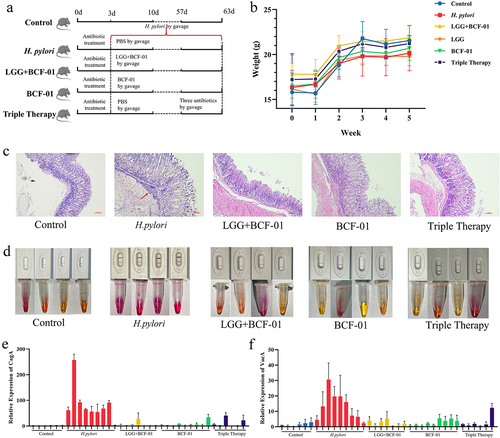
Figure 4. 16S rRNA sequencing and bioinformatic analysis of mouse intestinal content.
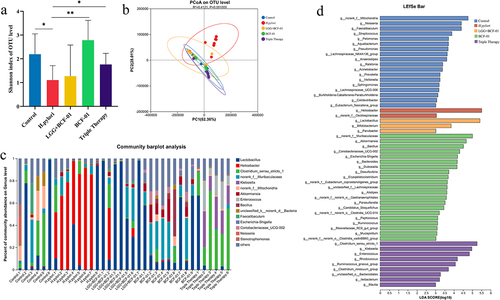
Figure 5. W. coagulans BCF-01 regulates mucosal immunity through the TLR4-NFκB-pyroptosis signaling pathway.
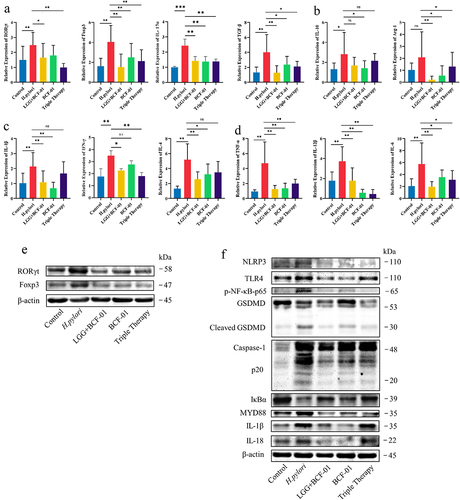
Figure 6. W. coagulans BCF-01 downregulates the TLR4-NFκB-pyroptosis signaling pathway in macrophages.
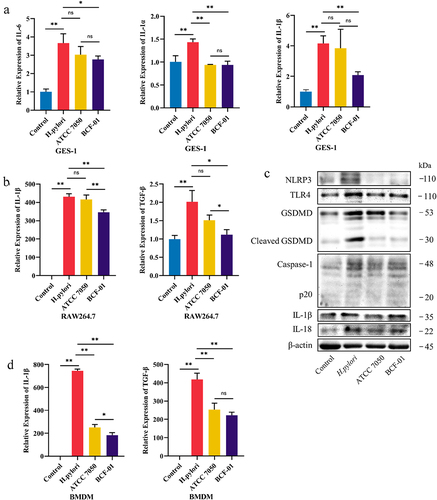
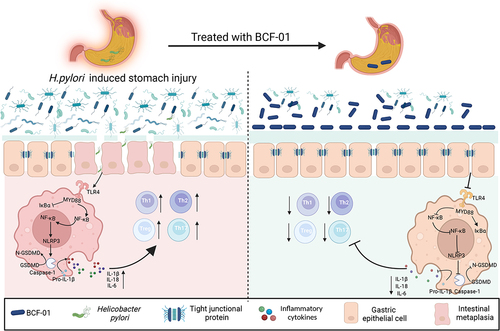
Figure 7. Schematic diagram summarizing the working model used in this study.
suppl figure.docx
Download MS Word (7.6 MB)Data availability statement
The data that support the findings of this study have been deposited in the CNGB Sequence Archive (CNSA) of the China National GeneBank DataBase (CNGBdb) under accession number CNP0005043.