
Figures & data
Figure 1. Metabolism of XN and related prenylflavonoids by gut microbiota. The conversion between XN and IXN can happen spontaneously. XN, xanthohumol; DXN, α,β-dihydroxanthohumol; IXN, isoxanthohumol; 8 PN, 8-prenylnarigenin; DMX, desmethylxanthohumol; DDXN, O-desmethyl- α,β-dihydroxanthohumol; 6 PN, 6-prenylnaringenin.
Table 1. Participant characteristics by intervention group.
Figure 2. (a) Principal coordinate analysis (PCoA) showing beta-diversity of XN-treated individuals across all time points. Enterotype clusters, indicated by different colors, were determined using partitioning around medoids (PAM) clustering of Jensen-Shannon diversity indices and robustness of clusters were assessed using the silhouette validation technique (average silhouette = 0.51). Each point represents a sample. (b) Each enterotype cluster was confirmed by variable abundance of one of three genera: Prevotella, Bacteroides, and Ruminococcus, and labeled by the dominant genera. (c) Genera with significantly different relative abundance between baseline and end-of-study (day 56) measures by enterotype clustering at baseline (Bacteroides, n = 5; Prevotella, n = 4; Ruminococcus, n = 5), as determined using a negative binomial generalized linear mixed effect model. The x-axis represents each baseline enterotype cluster and the y-axis represents genera. The color of each box represents the log2 fold change between baseline and day 56. o_ASV# or f_ASV# indicates an unannotated member of the order or family shown, respectively. White asterisks represent statistical significance after multiple testing correction. *, p < .05; **, p < .01; ***, p < .001.
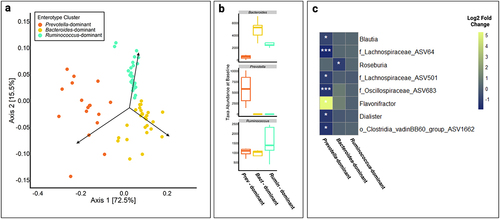
Figure 3. (a) Quantification of xanthohumol (XN) and metabolites of XN, isoxanthohumol (IXN), 8-prenylaringenin (8 PN), α,β-dihydroxanthohumol (DXN), and O-desmethyl-α,β-dihydroxanthohumol (DDXN), and 6-prenylnaringenin (6 PN) from fecal samples of XN treated individuals using selective reaction monitoring (SRM) LC-MS/MS. The colored lines represent the concentration of metabolites from each individual (n = 14) over time and the solid gray bars represent the mean concentration of metabolites measured at each time point. (b) Mean concentration of 6-prenylnaringenin (6 PN), 8-prenylaringenin (8 PN), O-desmethyl-α,β-dihydroxanthohumol (DDXN), and α,β-dihydroxanthohumol (DXN) from fecal samples of XN treated individuals over time and grouped by enterotypes. Each stacked bar represents mean concentration by time point in XN-treated participants. Relative to the Bacteroides enterotype (n = 5), the Prevotella enterotype (n = 4) produced significantly greater amounts of 6 PN (p = .05), 8 PN (p = .05), and DDXN (p = .02). Similarly, relative to the Bacteroides enterotype (n = 5), the Ruminococcus enterotype (n = 5) produced significantly greater amounts of 8 PN (p = .02) and DDXN (p = .02). This suggests that individuals with Prevotella or Ruminococcus enterotypes are higher metabolizers of XN, while individuals with Bacteroides enterotypes are lower metabolizers. There were no significant differences in DXN generation between enterotypes, suggesting each metabolize XN through this pathway. Prevotella and Ruminococcus enterotypes additionally metabolize XN through the 8 PN to DDXN pathway. Statistical significance was determined with linear mixed effect regression, modeling mean concentrations after baseline, with enterotype as a fixed effect and each participant as a random effect. Benjamini-Hochberg procedure was used to correct for multiple testing. (c) Concentrations of 8-prenylnaringenin (8 PN) production varied by BMI category in fecal (p = .03), plasma (p = .02), and 24-hr urine collections (p = .03). Each point represents mean concentration by time point and error bars represent SEM in XN-treated participants. “Healthy” BMI (n = 11) is defined as a BMI between 18.5 and 24.9 and “overweight” BMI (n = 3) is defined as a BMI between 25 and 29.9. Statistical significance was determined with linear mixed effect regression using time and BMI as fixed effects and each participant as a random effect. Benjamini-Hochberg procedure was used to correct for multiple testing.
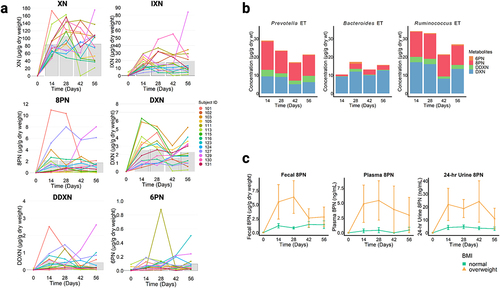
Figure 4. (a) HPLC-MS/MS product ion spectrum of a DXN (m/z 355) standard spiked in fecal matrix in negative ion mode. (b) HPLC-MS/MS product ion spectrum of DXN in negative ion mode from fecal samples of participant 115 at two weeks. (c) Proposed structures for the major MS/MS product ions of DXN in negative ion mode. (d) HPLC-MS/MS product ion spectrum of DDXN (m/z 341) in negative ion mode after incubation of 8 PN with Eubacterium ramulus.Citation1 (e) HPLC-MS/MS product ion spectrum of DDXN in negative ion mode from fecal samples of participant 101 at two weeks. Contamination by additional fragment ions originate from molecular ions of m/z 341 in feces that co-elute with DDXN. (f) Proposed structures for the major MS/MS product ions of DDXN in negative ion mode.
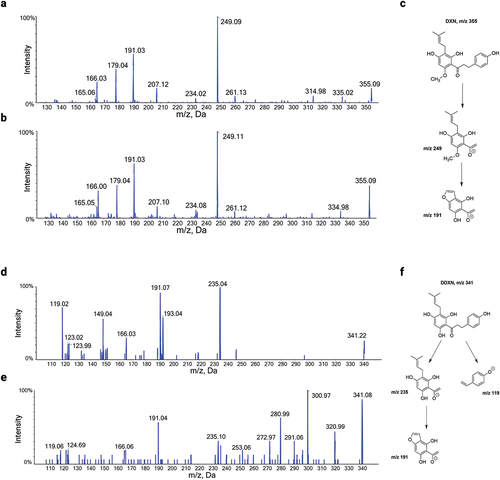
Figure 5. A heatmap representation of a sparse partial least squares (sPLS) regression analysis of the fecal microbial community composition data at the genus level and the concentration of XN and XN metabolites in XN-treated participants after baseline. Associations with correlation coefficients between –0.25 and 0.25 were filtered from the heatmap, which removed all associations with 6 PN.
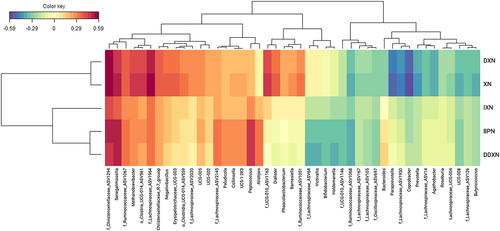
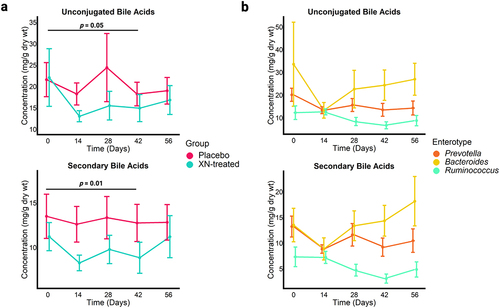
Figure 6. (a) Concentrations of microbially derived bile acids significantly decreased in the XN-treated group at 42 days compared to baseline levels but returned to baseline by study close-out. Each point represents mean concentration by time point and error bars represent SEM. Statistical significance was determined with linear mixed effect regression using the interaction of treatment and time as a fixed effects and each participant as a random effect. Benjamini-Hochberg procedure was used to correct for multiple testing. (b) Statistically significant reduction in microbially derived bile acids in the XN-treated group were specific to Prevotella (n = 4) and Ruminococcus (n = 5) enterotype clusters (unconjugated bile acids, p = .01; secondary bile acids, p = .005). These changes in bile acid composition remained borderline statistically significant for these groups at study close-out (day 56: unconjugated bile acids, p = .06; secondary bile acids, p = .05), but the effect was originally overwhelmed by the variable signal that resulted from including the Bacteroides enterotype (n = 5). Each point represents mean concentration by time point and error bars represent SEM. Statistical significance was determined with linear mixed effect regression using the enterotype cluster and time as a fixed effects and each participant as a random effect. Benjamini-Hochberg procedure was used to correct for multiple testing.
Supplementary Material_Final.docx
Download MS Word (1.2 MB)Data availability statement
R code is available at github: https://github.com/jamiesop/Jamieson_XN_Microbiome. The targeted LC-MS/MS data obtained in this study has been submitted to the NIH Common Fund’s NMDR (supported by NIH grant, U01-DK097430) website, the Metabolomics Workbench, under study ID’s ST002941 (XN metabolites), ST002942 (short-chain fatty acids), and ST002943 (bile acids). The remaining individual participant data will be available from the corresponding author upon reasonable request.