
Figures & data
Figure 1. Experimental design and schematic summary in rats. Specific details of animal experimental design are shown in the materials and methods.
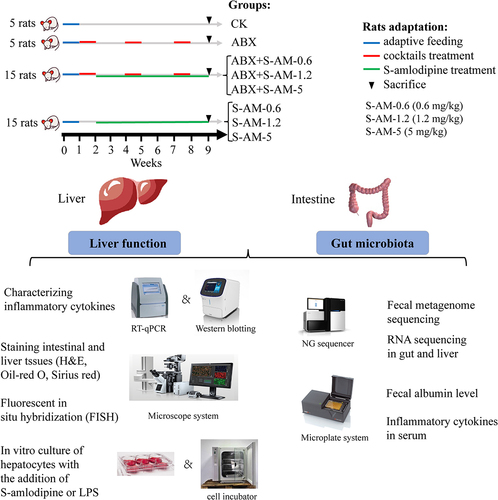
Figure 2. S-amlodipine induced hepatic inflammation and a shift in liver indexes in rats. (a) Representative pictures of liver sections after H&E, Oil Red O, or Sirius Red staining are shown in panels. Arrows indicate regions of lesions. (b-d) the histology score of the liver was evaluated (b), and the quantitation of the oil-red area (c) or the fibrosis area (d) was measured. Scale bars, 50 μm. N = 3 per group. (e) Volcano plot showing the comparative transcriptomic analysis (visualization of DEGs) of the liver in the S-AM-5 group versus the CK group. (f) KEGG enrichment analysis of DEGs in the S-AM-5 group versus the CK group based on RNA-seq. The red squares represent significantly upregulated pathways, while blue squares represent significantly downregulated pathways. (g) The mRNA expression of inflammatory genes in the liver were detected by RT-qPCR. N = 5 per group. (h) The mRNA expression of Nfκb1, chemokine CCL2 and TLR4 genes in the liver were detected by RT-qPCR. N = 5 per group. (i-j) serum level of TNF-α (i), and IL-6 (j) were measured by ELISA. N = 5 per group. (k-n) the serum ALT (k), TG (l), Tch (m), and HDL-c (n) level in rats. N = 3 per group. (o) Hepatic MDA level. N = 5 per group. ALT, alanine transaminase; TG, triglycerides; Tch, total cholesterol; HDL-c, high-density lipoprotein cholesterol. MDA, malondialdehyde. Significance was determined using t test analysis. *p < 0.05, **p < 0.01.
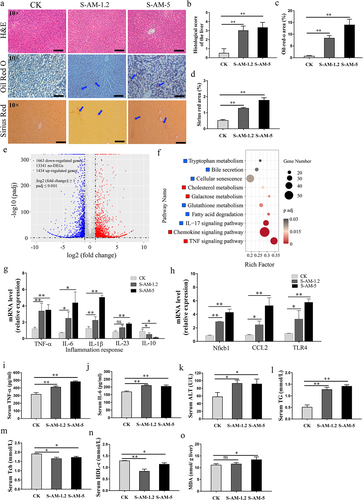
Figure 3. Metagenomic sequencing analysis uncovers obvious alterations in the composition and structure of the gut microbiome following 0.6 ~ 1.2 mg/kg of S-amlodipine treatment. (a), (c) and (f) Principal component analysis (PCA) of nine samples (CK group (N = 3) and S-amlodipine group (S-AM-0.6 and S-AM-1.2, N = 3 per group) based on phylum (a), genus (c) and species (f) level. (b) and (d) relative abundance of fecal bacteria at the phylum level (b) and genus level (d). (e) Relative abundance of bacteria in the gut was further analyzed using LEfSe analysis. (g) and (h) Heatmaps generated using R studio shows the taxonomic abundance at the species level based on metagenomic sequencing analysis results. The data is standardized. N = 3 per group. #, p < 0.05, and ##, p < 0.01, S-AM-0.6 group compared with the CK group; *, p < 0.05, and **, p < 0.01, S-AM-1.2 group compared with the CK group. (i-j) comparison of the taxonomic abundance of main species potentially associated with the production of LPS was performed based on metagenomic sequencing analysis. Significance was determined using t test analysis. Data are presented as the mean ± SEM. *p < 0.05, **p < 0.01.
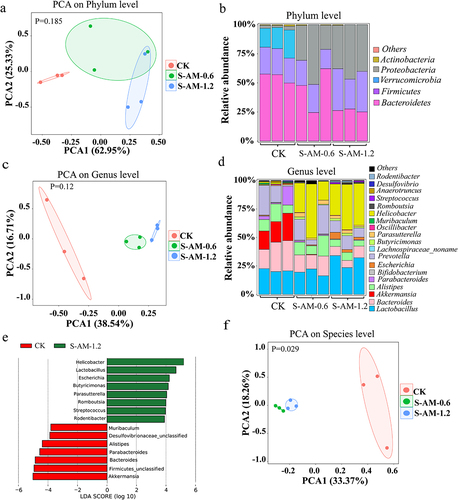
Figure 3. (Continue).
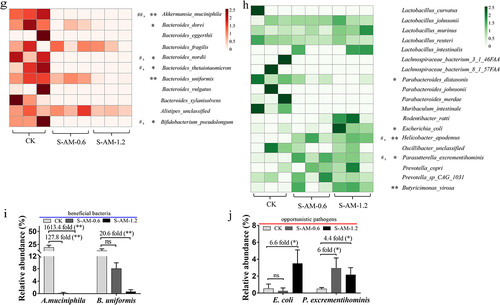
Figure 4. S-amlodipine treatment induces intestinal inflammation by altering the gut microbiome. (a) The mRNA expression of inflammatory genes in the colon was detected by RT-qPCR. N = 5 per group. (b) Representative images of western blot analysis on colon tissues were obtained, and the protein expression of TNF-α and NFκB was quantified. (c-d) FACS analysis was performed on colon-isolated immune cells (Treg cells (c) and Th17 cells (d)), and the data was quantified. N = 3 per group. Values are mean ± SEM. *p < 0.05, **p < 0.01.
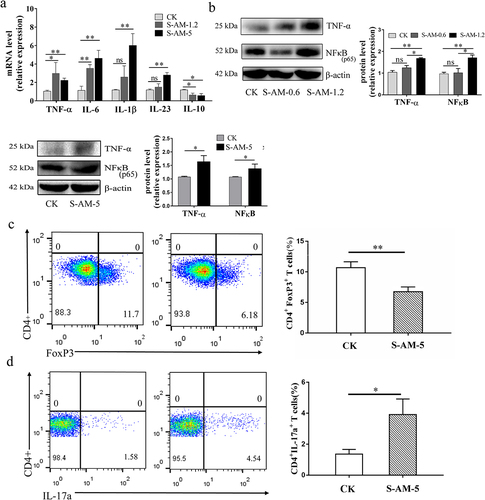
Figure 5. The alteration of the gut microbiome induced by S-amlodipine damages the intestinal barrier function and motivates bacterial invasion into the mucus layer in rats. (a) Bacterial 16s rRNA was stained using the EUB338 probe in colon sections and the relative fluorescence intensity (FI) was calculated utilizing ImageJ software. N = 3 per group. Scale bars, 25 μm. (b) Representative images of HE staining of colons were obtained, and the histology score of the colons was determined. N = 3 per group. (c) RT-qPCR analysis on colon extracts was performed to assess the mRNA expression of claudin-4 and occludin, which showed a decline in the S-amlodipine group. N = 5 per group. (d) Representative images of western blot analysis on colon tissues were obtained, and the protein expression of claudin-4 and occludin was quantified. (e) Representative images of immunochemistry staining for distribution of claudin-3 in colon tissues. N = 3 per group. Scale bars, 50 μm. (f) The fecal albumin contents and the serum LPS level in rats were measured. N = 5 per group. *p < 0.05, **p < 0.01. Arrows indicate regions of lesions.
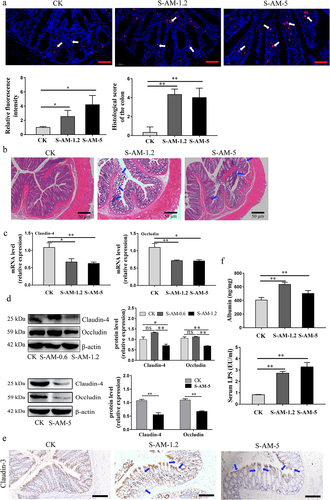
Figure 6. S-amlodipine-induced hepatic inflammation in rats is mediated by disordered intestinal microbiota and their LPS. (a) Representative pictures of liver sections stained with H&E, Oil Red O, or Sirius Red were obtained. Arrows indicate regions of lesions. (b) The histology score of the liver was evaluated (b), and the quantitation of the Oil-Red-O area (c) and fibrosis area was performed (d). N = 3 per group. Scale bars, 50 μm. (e-f) the serum levels of TNF-α (e) and IL-6 (f) were measured by ELISA. N = 5 per group. (g) Hepatic TNF-α level was determined. N = 5 per group. (h) The mRNA expression of inflammatory genes in the liver was detected by RT-qPCR. N = 5 per group. (i) The mRNA expression of Nfκb1, chemokine CCL2, and TLR4 genes in the liver was detected by RT-qPCR. N = 5 per group. (j-k) Representative images of western blot analysis on liver tissues were obtained (j), and the protein expression of TNF-α and TLR4 was quantified (k). *p < 0.05, **p < 0.01. ns, no significant difference.
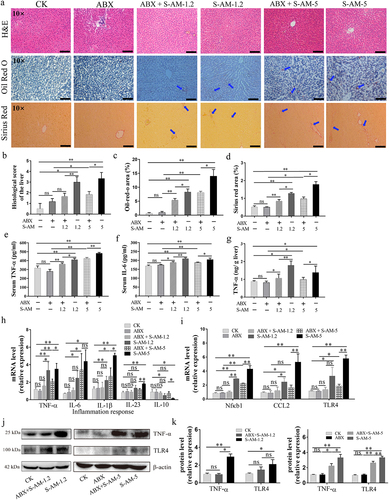
Figure 7. The shift of liver indexes in rats induced by S-amlodipine is mediated by disordered intestinal microbiota. (a-d) the serum levels of ALT (a), TG (b), Tch (c), and HDL-c (d) were measured in rats. N = 3 per group. (e) The fecal LPS level was determined. (f) The serum LPS level was measured. (e-f) N = 5 per group. ALT, alanine transaminase; TG, triglycerides; Tch, total cholesterol; HDL-c, high-density lipoprotein cholesterol. *p < 0.05, **p < 0.01. ns, no significant difference.
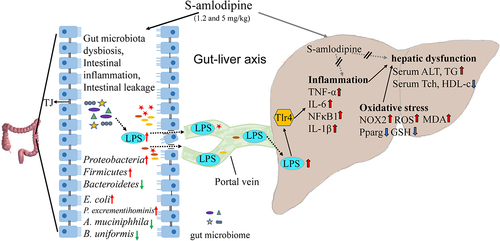
Figure 8. Schematic summary. S-amlodipine does not directly cause hepatocytes damage. However, 1.2 ~ 5 mg/kg of S-amlodipine treatment disrupts the gut microbiome in rats by reducing the abundance of beneficial bacteria and increasing the abundance of opportunistic pathogens. This alteration leads to an increase in fecal LPS content, triggering intestinal inflammation and upregulating the mRNA and proteins expression of pro-inflammation cytokines. The increased intestinal permeability results in the downregulation of tight junction proteins, and subsequently increased serum LPS concentration. Bacteria-derived LPS enters the liver through the portal vein and binds to TLR4 on hepatocytes and immune cells, inducing liver inflammation and oxidative stress. This process ultimately gives rise to hepatic inflammation and associated dysfunction in rats.
Supplemental Material
Download Zip (120.6 MB)Supplementary file 1 clean.docx
Download MS Word (6.2 MB)Supplementary file 3.xls
Download MS Excel (38.7 KB)Supplementary file 2.xls
Download MS Excel (38.4 MB)Data availability statement
The clean sequencing datasets of fecal metagenome sequencing have been deposited in the CNCB Genome Sequence Archive (GSA) under the BioProject accession number PRJCA005398. The RNA sequence datasets of the liver were accessible under the BioProject accession number PRJCA005400.