
Figures & data
Figure 1. S. Tm prevents host mitochondrial fragmentation to promote intracellular replication.
(a) Representative immunofluorescence images of mitochondrial morphology in BMDMs infected with GFP-expressing WT and heat-killed WT at 0, 2, and 8 h p.i. Mitochondria, red; WT, green. Scale bars, 5 µm. (b) The proportion of cells with fragmented mitochondria after being infected with GFP-expressing WT and heat-killed WT at 0, 2, and 8 h p.i. (c) Representative immunofluorescence images of mitochondrial morphology in Mdivi1- or FCCP-treated BMDMs infected with GFP-expressing WT at 0, 2, and 8 h p.i. Mitochondria, red; WT, green. Scale bars, 10 µm. (d) The proportion of cells with fragmented mitochondria after pretreatment with Mdivi1 or FCCP followed by infection with GFP-expressing WT at 0, 2, and 8 h p.i. (e) Immunofluorescence analysis of the intracellular bacteria per BMDM after pretreatment with Mdivi1 or FCCP followed by infection with GFP-expressing WT at 0, 2, and 8 h p.i. (f) Relative replication fold of WT in BMDMs pretreated with Mdivi1 or FCCP. The WT (b, d – f) served as the control. UN, uninfected. Data are presented as mean ± SD (n = 15 fields (b, d), n = 100 cells (e), or n = 3 independent experiments (f)). Significant differences were assessed using two-way ANOVA (b, d, e, f). Error bars represent SD. *P < .05, ***P < .001; ns, no significant difference.
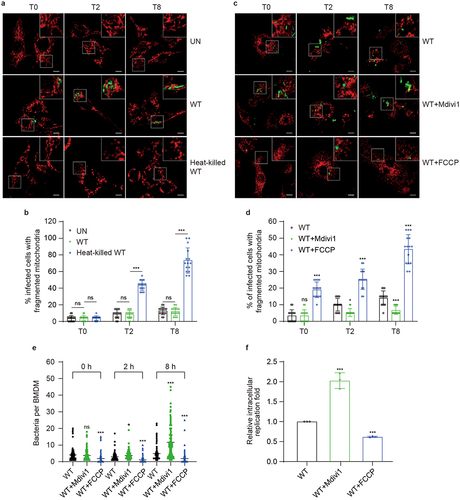
Figure 2. SipA is required to prevent mitochondrial fragmentation during infection.
(a) Domain architectures of S. Tm 14028s FSipA and MSipA. (b) Representative immunofluorescence images of Raw264.7 macrophages transfected with pCMV-C-GFP, pCMV-FSipA-GFP, or pCMV-MSipA-GFP plasmids after 24 h. Mitochondria, red; the indicated proteins, green. Scale bars, 10 µm. (c) Pearson’s correlation coefficient for the indicated protein and mitochondria colocalization after 24 h of transfection. (d) Expression levels of SipA in Raw264.7 macrophages transfected with pCMV-C-GFP, pCMV-FSipA-GFP, or pCMV-MSipA-GFP plasmids for 24 h followed by immunoblotting with antibody against GFP tag. (e) The analysis of colocalization for SipA and mitochondria by immunoblotting using antibody against the FLAG tag. (f) Representative immunofluorescence images of BMDMs infected with the ΔsipA+pFSipA or ΔsipA+pMSipA at 8 h p.i. FSipA and MSipA were tagged with FLAG. Mitochondria, red; the indicated protein, green; nucleus, blue. Scale bars, 5 µm. (g) Pearson’s correlation coefficient for the indicated protein and mitochondria colocalization at 8 h p.i. (h) Detection of SipA secreted by ΔsipA, ΔsipA+pFSipA and ΔsipA+pMSipA under T3SS inducing conditions in bacterial culture supernatants. Total proteins were quantified by SDS-PAGE stained with Coomassie blue staining. Protein SipA was detected by immunoblotting using antibody against the FLAG tag. (i) Detection of SipA in bacterial cell lysates from ΔsipA, ΔsipA+pFSipA and ΔsipA+pMSipA by immunoblotting using antibody against the FLAG tag. (j) Detection of SipA secreted in BMDMs infected with ΔsipA, ΔsipA+pFSipA and ΔsipA+pMSipA by immunoblotting with an antibody against the FLAG tag. (k) Representative immunofluorescence images of mitochondrial morphology in BMDMs infected with GFP-expressing WT, ΔsipA, ΔsipA+pFSipA, or ΔsipA+pMSipA at 0, 2, and 8 h p.i. Mitochondria, red; S. Tm, green. Scale bars, 10 µm. (l) The proportion of cells with fragmented mitochondria after being infected with GFP-expressing WT, ΔsipA, ΔsipA+pFSipA, or ΔsipA+pMSipA at 0, 2, and 8 h p.i. The GFP (c), FSipA (g), or WT (l) served as controls. FSipA, full-length SipA; MSipA, MTS-deleted SipA. β-Actin, cytosolic control; Tomm20, mitochondrial control; GroEL, bacterial control. Data are presented as mean ± SD (n = 30 fields (c, g), n = 15 fields (l)). Significant differences were assessed by two-tailed unpaired Student’s t-test (g) or two-way ANOVA (c, l). Error bars represent SD. ***P < .001,; ns, no significant difference.
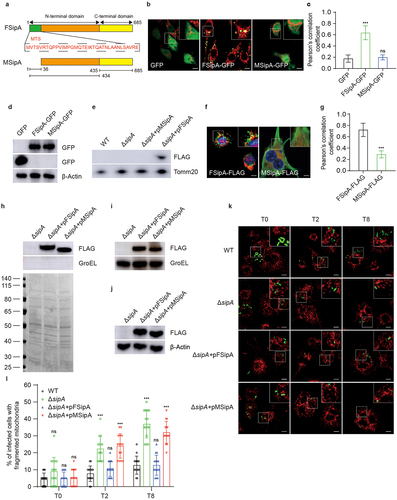
Figure 3. Lack of sipA increases mitochondrial dysfunction.
(a) Representative immunofluorescence images of mtROS in BMDMs infected with GFP-expressing WT, ΔsipA, ΔsipA+pFSipA, or ΔsipA+pMSipA at 0, 2, and 8 h p.i. mtROS, red; S. Tm, green; nucleus, blue. Scale bars, 10 µm. (b) MitoSOX fluorescence intensity analysis of mtROS in BMDMs infected with GFP-expressing WT, ΔsipA, ΔsipA+pFSipA, or ΔsipA+pMSipA at 0, 2, and 8 h p.i. (c) The time-lapse photography of ΔΨm in BMDMs infected with GFP-expressing WT, ΔsipA, ΔsipA+pFSipA, or ΔsipA+pMSipA during 8 h p.i. ΔΨm, red; S. Tm, green. Scale bars, 2 µm. (d) TMRM fluorescence intensity analysis of ΔΨm in BMDMs infected with GFP-expressing WT, ΔsipA, ΔsipA+pFSipA, or ΔsipA+pMSipA at 0, 2, and 8 h p.i. (e, f) The qPCR analysis of cytosolic mtDNA levels in BMDMs infected with WT, ΔsipA, ΔsipA+pFSipA, or ΔsipA+pMSipA at 0, 2, and 8 h p.i. (g, h) Representative immunoblotting image of cytosolic (g) and mitochondrial (h) cytochrome c levels in BMDMs infected with WT, ΔsipA, ΔsipA+pFSipA, or ΔsipA+pMSipA at 0, 2, and 8 h p.i. (i, j) Immunoblotting analysis of cytosolic (i) and mitochondrial (j) cytochrome c levels. The WT served as the control (b, d – f, i, j). CytC, cytochrome c. β-Actin, cytosolic control; Tomm20, mitochondrial control. Data are presented as mean ± SD (n = 15 fields (b, d) or n = 3 independent experiments (e, f, i, j)). Significant differences were assessed using two-way ANOVA (b, d – f, i, j). Error bars represent SD. *P < .05, **P < .01, ***P < .001; ns, no significant difference.
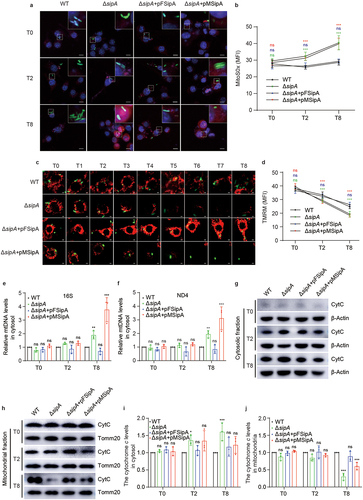
Figure 4. SipA enhances S. Tm intracellular replication by targeting mitochondria.
(a) Representative immunofluorescence images of intracellular bacteria in BMDMs infected with GFP-expressing WT, ΔsipA, ΔsipA+pFSipA, or ΔsipA+pMSipA at 0, 2, and 8 h p.i. Mitochondria, red; S. Tm, green. Scale bars, 10 µm. (b) Immunofluorescence analysis of the intracellular bacteria per BMDM after infection with GFP-expressing WT, ΔsipA, ΔsipA+pFSipA, or ΔsipA+pMSipA at 0, 2, and 8 h p.i. (c) Relative replication fold of WT, ΔsipA, ΔsipA+pFSipA, or ΔsipA+pMSipA in BMDMs. (d, e) Liver and spleen bacterial burdens in BALB/c mice intraperitoneally infected with WT, ΔsipA, ΔsipA+pFSipA, or ΔsipA+pMSipA. The WT served as the control (b – e). Data are presented as mean ± SD (n = 100 cells (b), n = 3 independent experiments (c) or n = 12 mice per group (d, e)). Significant differences were assessed using two-tailed unpaired Student’s t-test (b, c) or Mann–Whitney U-test (d, e). Error bars represent SD. *P < .05, **P < .01, ***P < .001; ns, no significant difference.
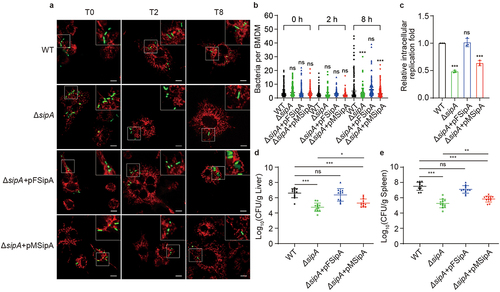
Figure 5. SipA prevents the recruitment of Drp1 to host mitochondria.
(a) Representative immunoblotting image of Drp1 level on mitochondria in BMDMs infected with WT, ΔsipA, ΔsipA+pFSipA, or ΔsipA+pMSipA at 0, 2, and 8 h p.i. (b) Immunoblotting analysis of Drp1 levels on mitochondria. (c) Immunoprecipitation of SipA and Drp1 in Raw264.7 macrophages. The WT served as the control (b). Tomm20, mitochondrial control; β-Actin, cytosolic control. Data are presented as mean ± SD (n = 3 independent experiments (b)). Significant differences were assessed using two-way ANOVA (b). Error bars represent SD. *P < .05, ***P < .001; ns, no significant difference.
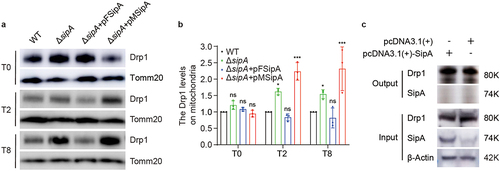
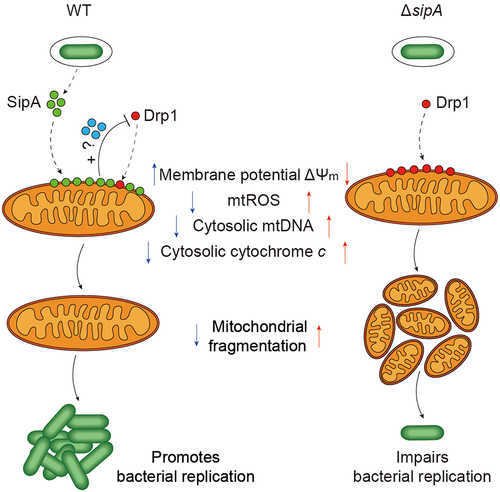
Figure 6. Model of S. Tm remodeling mitochondrial dynamics for its efficient replication.
When S. Tm enters the host cells, WT secretes effector SipA, which can target mitochondria and inhibit the recruitment of Drp1 to mitochondria through indirect interaction, thus inhibiting Drp1-mediated mitochondrial fragmentation for bacterial replication. In contrast, when it lacks effector SipA, ΔsipA fails to inhibit Drp1 recruitment to mitochondria and the following Drp1-mediated mitochondrial fragmentation, thus impairing bacterial replication.
Supplemental material
Supplementary material revised clean.docx
Download MS Word (1.2 MB)Data availability statement
The authors confirm that the data supporting the findings of this study are available within the article [and/or] its supplementary materials.