
Figures & data
Figure 1. (a) Numbers of study participants by study group and by diagnosis. (b) Sample collection timeline. (c) Fecal calprotectin measurements at 3 study visits in stool samples of pediatric IBD (orange) and VEO-IBD (red) patients. The dotted line indicates a cut off of 250ug/g, below which was consistent with lower disease activity. Boxplot demonstrates median and interquartile values, and whiskers are minimum and maximum values. (d) Fecal calprotectin measurements over 3 study visits by disease cohort.. Left panel includes patients who started new therapy during the study and demonstrates decrease trend in calprotectin for 8 weeks, which was not seen among patients on maintenance therapy (right panel).
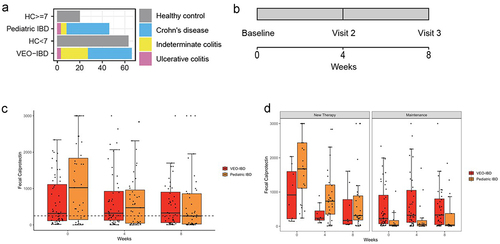
Table 1. Clinical characteristics of all study groups.
Table 2. Clinical characteristics of patients with inflammatory bowel disease.
Figure 2. Comparison of fecal microbiota composition among study groups. samples are color coded to indicate the four study groups (green: HC ≥ 7, orange: pediatric IBD, blue: HC < 7, red: VEO-IBD). (a) Species richness at 3 study visits colored by study group. (b) Principal coordinate analysis of based on Bray-Curtis dissimilarity assessed using microbiome data. Samples collected at baseline visit, visit 2 (4 weeks), and visit 3 (8 weeks) are shown in separate facets. (c) Comparison of taxa prevalence and abundance in VEO-IBD and HC <7 years old. Top panel: taxa with significantly lower prevalence or abundance in VEO-IBD samples than HC < 7. Bottom panel: taxa with significantly increased prevalence and/or abundance in VEO-IBD compared to HC < 7. Asterisks demonstate comparisons with p < 0.05.
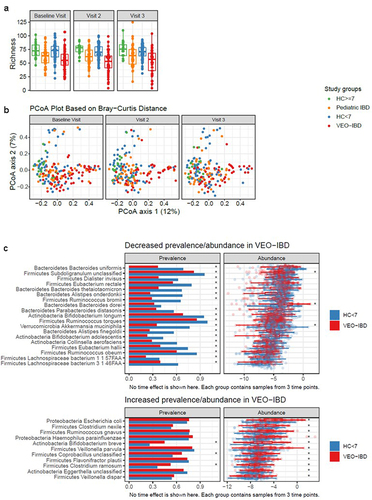
Figure 3. Ratio of log2 transformed KEGG ortholog abundances between VEO-IBD and pediatric IBD (figure 3a) and VEO-IBD and healthy controls <7 years old (figure 3B). positive values indicate higher abundance in VEO-IBD (in red), and negative values indicate higher abundance in pediatric IBD (in orange) and in HC < 7 (in blue). (c) Correlation of top 30 most abundant gene orthologs with top 30 significantly different taxa detected in VEO-IBD. heatmap indicates degree of correlation with blue positive and red negative and asterisk denotes significance. the asterisks within the heat map indicate a p value of < 0.05.
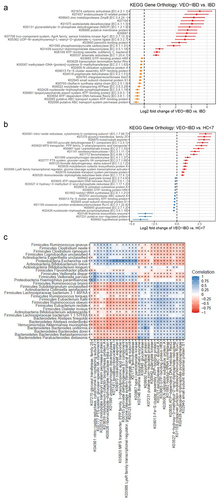
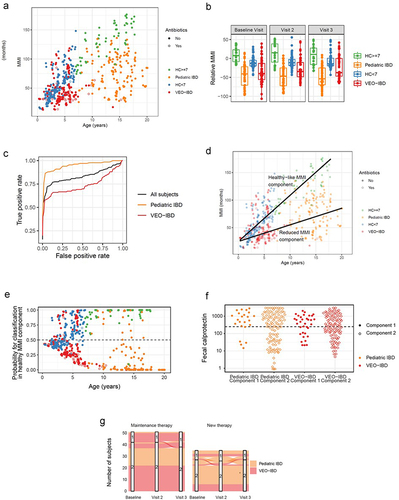
Figure 4. The microbiota maturity index (MMI) was developed from healthy controls in order to identify the taxa most associated with health at different ages. (a) Each sample’s MMI was plotted against chronological age and colored by study group. samples with recent/current antibiotic exposure are denoted with open circle. With increased chronological age, there is a divergence in MMI between older healthy controls and pediatric IBD, not seen in younger children. (b) The relative MMI is lowest among patients with pediatric IBD and more heterogeneous among children with VEO-IBD than healthy controls. (c) Receiver operating characteristic (ROC) curve analysis demonstrates the efficacy of relative microbial maturity index to predict disease status. RMMI is a good predictor of disease status overall with AUC = 0.83. It performed better at predicting pediatric IBD status (AUC = 0.93) than VEO-IBD (AUC = 0.74). (d) Figure 4A plot of MMI with the addition of lines fit to two component model, including healthy-like MMI component fit among the HC and reduced-MMI component. (e) Each sample’s probability of being in healthy-like MMI component 1 vs reduced MMI component 2. There is greater separation with increasing age suggesting the model can discern samples more effectively in the older age groups. (f) Fecal calprotectin grouped by disease group and component demonstrated that despite differences in microbial communities in each component there were not differences in disease activity as measured by calprotectin. (g) There were limited numbers of patients whose samples switched component groups between healthy and non-healthy components during follow up. Those subjects that did see more variability were more likely to have been started on new therapy during the study window than those on stable maintenance therapy.