
Figures & data
Figure 1. Mice exposed to high-dose oxaliplatin exhibited severe systemic side effects. (a) Oxaliplatin toxicity experimental design. SPF C57BL/6 mice were treated by oxaliplatin every five days for four times. (b-d) Changes of body weight (p < .0001) (b), clinical score (p= .0085) (c), and survival analysis after administration of oxaliplatin (p = .03) (d). (e) Total red blood cell count (p < .0001), total white blood cell count (p < .0001), total blood platelet count (p = .0001) and hemoglobin (p = .0033) in blood of mice with oxaliplatin intervention. (f) Representative histopathological images of spleens (Scale bars, 200 μm). (g) Representative histopathological images of colon and quantification for the gaps between crypt bases and muscularis mucosa (p = .0002) (Scale bars, 200 μm). Arrows indicate gaps between crypt bases and muscularis mucosa. (h) Experimental design of SPF C57BL/6 mice with injection of MC38 cells, followed by oxaliplatin intervention. (i–k) Changes of body weight (p < .0001) (i), clinical score (p < .0001) (j), and survival analysis after administration of oxaliplatin (p = .0122) (k). (l) Total red blood cell count (p = .0182), total white blood cell count (p < .0001), total blood platelet count (p < .0001) and hemoglobin (p < .0001) in blood of mice with oxaliplatin intervention. (m) Representative histopathological images of spleens (Scale bars, 200 μm). (n) Representative histopathological images of colon and quantification for the gaps between crypt bases and muscularis mucosa (p<.0001) (Scale bars, 200 μm). (o–p) Changes of tumor sizes p = .0003) and tumor weights (p = .0186) in mice treated with oxaliplatin or PBS. (h) Representative images of subcutaneous tumors from mice with treatment of oxaliplatin or PBS. Each dot indicates an individual mouse. For b-d, control: n=6, OXA: n=30. For i-k, control: n=10, OXA: n=10. The statistical significance values are denoted as: *p < .05, **p < .01, ***p < .001, ****p < .0001. Two-way ANOVA following Sidak’s multiple comparison test (b, c, i, j and o); two tailed Student t test (e, g, l, n and p); log-rank test (d and k).
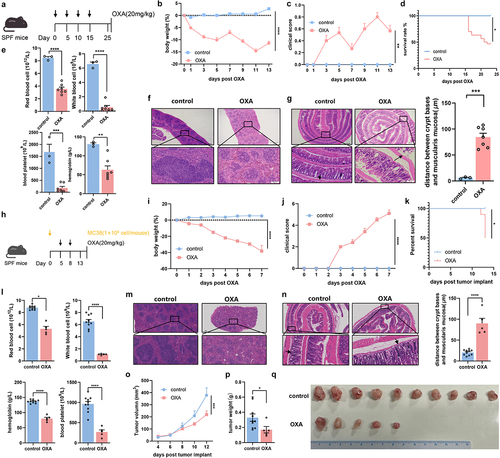
Figure 2. Gut microbiota altered by chemotherapy mediates the chemotherapy-induced toxicity. (a) FMT experimental design. After treated by antibiotics, mice were received FMT three times a week until end of the test. FMT recipient mice were subsequently challenged with oxaliplatin. (b–d) Changes of body weight (p = .0038) (b), clinical score (p=.0134) (c), and survival analysis (p = .0726) after administration of oxaliplatin (d). (e) Total red blood cell count (p = .0252), total white blood cell count (p = .2546), hemoglobin in blood (p = .0291) and total blood platelet count (p = .0523) of mice with FMT. (f) Histopathological images of spleens (Scale bars, 200 μm). (g) Femurs from mice with FMT were stained with H&E and quantification for bone marrow cellularity (Scale bars, 100 μm). (h) Histopathological images of colon and quantification for the gaps between crypt bases and muscularis mucosa (p < .0001) (Scale bars, 200 μm). Arrows indicate gaps between crypt bases and muscularis mucosa. Each dot indicates an individual mouse. For b-d, control-FMT: n=9, OXA-FMT: n=20. The statistical significance values are denoted as: *p < .05, ** p < .001, **** p < .0001. Two-way ANOVA following Sidak’s multiple comparison test (b, c); two tailed student t test (e, g, and h); log-rank test (d).
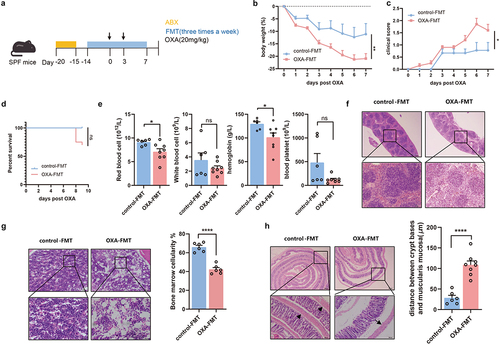
Figure 3. Microbiota-mediated toxicity of chemotherapy is macrophage-dependent. (a) Splenic transcriptome from recipient mice with FMT, revealed by PCoA (adonis p = .022). (b) Distribution of splenic immune cells was revealed by transcriptome. (c) Pathway analysis of the immune-associated differential expression genes. (d) After treatment of antibiotics cocktail, Rag1-/- mice with FMT were injected with oxaliplatin. (e–g) Changes of body weight (p=.0004) (e), clinical score (p < .0001) (f), and survival analysis (g) after administration of oxaliplatin. (h) Histopathological images of colon. Arrows indicate gaps between crypt bases and muscularis mucosa (Scale bars, 200 μm). (i) Femurs from Rag1-/- mice were stained with H&E (Scale bars, 100 μm). (j) Experimental design of macrophage depletion. Mice with antibiotics cocktail intervention were treated with clodronate liposomal or PBS liposomal, followed by FMT treatment and oxaliplatin treatment. (k–l) Changes of body weight (control-FMT vs. OXA-FMT: p = .0298, control-FMT vs. control-FMT+Clodronate: p = .02, control-FMT vs. OXA-FMT+Clodronate: p = .0343) (k) and clinical score (control-FMT vs. OXA-FMT: p < .0001, control-FMT vs. control-FMT+Clodronate: p = .0005, control-FMT vs. OXA-FMT+Clodronate: p = .0009) (l) after administration of oxaliplatin. (m,n) Histopathological images of colon and quantification for the gaps between crypt bases and muscularis mucosa (Scale bars, 200 μm). Arrows indicate gaps between crypt bases and muscularis mucosa (control-FMT vs. OXA-FMT: p=.0057, control-FMT vs. control-FMT+Clodronate: p < .0001, control-FMT vs. OXA-FMT+Clodronate: p = .0001). (o) Femurs from mice with FMT were stained with H&E and quantified for bone marrow cellularity (control-FMT vs. OXA-FMT: p = .0338, control-FMT vs. control-FMT+Clodronate: p = .0433, control-FMT vs. OXA-FMT+Clodronate: p = .0193) (Scale bars, 100 μm). (p) Histopathological images of spleens (Scale bars, 200 μm). Each dot indicates an individual mouse. For a-d, control-FMT: n=4, OXA-FMT: n=4. For f-g, Rag1−/−+control-FMT: n=6, Rag1−/−+OXA-FMT: n=5. For k-l, control-FMT: n=9, OXA-FMT: n=8, control-FMT+Clodronate: n=7, OXA-FMT+Clodronate: n=6. The statistical significance values are denoted as: * p < .05, ** p < .01, *** p < .001, **** p < .0001. Two-way ANOVA following Sidak’s multiple comparisons test (e and f); log-rank test (g); one-way ANOVA following Tukey’s multiple comparison test (n and o); two-way ANOVA following Tukey’s multiple comparison test (k and l).
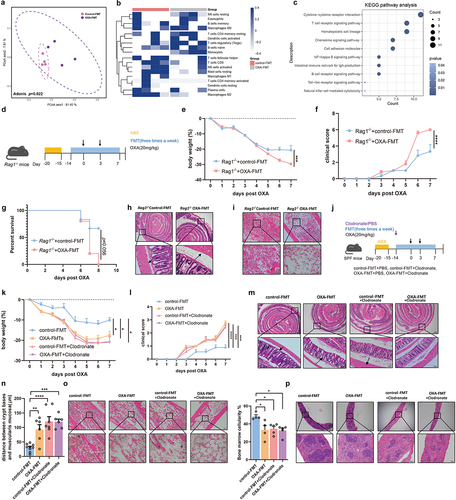
Figure 4. Suppression of IL-10 is responsible for chemotherapy-induced toxicity. (a) Cytokine/chemokine profile of the serum from mice with FMT. An asterisk (*) indicated the significant change of cytokine. (b) In colon tissue, the immunohistochemical staining of IL-10 (p = .0145) was analyzed from the perspective of histological grades (H score) (Scale bars, 200 μm). (c) In spleen tissue, the immunohistochemical staining of IL-10 (p = .0426) was analyzed from the perspective of histological grades (H score) (Scale bars, 200 μm). (d) Experimental design of supplement rIL-10 or PBS for SPF C57BL/6 mice, followed by oxaliplatin intervention. (e,f) Changes of body weight (p = .0347) (e) and clinical score (p < .0001) (f) after administration of oxaliplatin. (g) Femurs from mice with rIL-10 or PBS supplement were stained with H&E and quantified for bone marrow cellularity (p < .0001) (Scale bars, 100 μm). (h) Histopathological images of spleens (Scale bars, 200 μm). (i–j) Histopathological images of colon (Scale bars, 200 μm) and quantification for the gaps between crypt bases and muscularis mucosa (p = .0002). Arrows indicate gaps between crypt bases and muscularis mucosa. (k) Relative mRNA levels of ZO-1 (p = .0478) and occluding (p = .0370) in the colon from mice with rIL-10 or PBS supplement. Each dot indicates an individual mouse. For a, control-FMT: n=2, OXA-FMT: n=2. For e-f, control: n=8, rIL-10: n=9. The statistical significance values are denoted as: *p < .05, ***p < .001, **** p < .0001. Two-way ANOVA following Sidak’s multiple comparison test (e and f); two tailed student t test (b, c, g, j, and k).
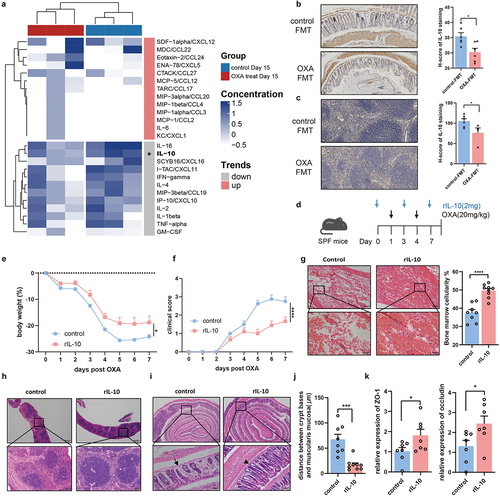
Figure 5. Chemotherapy toxicity-associated IL-10 secretion in macrophages is through TLR4. (a) IL-10 secretion from CD4+ cells (p = .2838), Treg cells (p = .8194), and macrophages (p = .0265) in control-FMT mice and OXA-FMT mice were analyzed by flow cytometry. (b) IL-10 secretion from CD4+ cells (p = .1639), Treg cells (p = .1432), and macrophages (p = .0041) in control-FMT (no OXA) mice and OXA-FMT (no OXA) mice were analyzed by flow cytometry. (c) Splenocytes from Rag1-/- mice were stimulated by feces supernatant from control or oxaliplatin-treated mice for 24 hours. Expression of IL-10 in F4/80+ macrophages were analyzed by flow cytometry (p = .0391). (d) Adoptive transfer of macrophage mice model. F4/80+ macrophages were isolated from Il10-/- and WT mice respectively. Isolated macrophages were transferred into Il10-/- mice followed by twice of oxaliplatin treatment. (e,f) Changes of body weight (p = .0252) (e) and clinical score (p = .0188) (f) after administration of oxaliplatin. (g) Histopathological images of colon and quantification for the gaps between crypt bases and muscularis mucosa (p = .0042) (Scale bars, 200 μm). Arrows indicate gaps between crypt bases and muscularis mucosa. Each dot indicates an individual mouse. For d, control recipient: n=5, Il10-/- recipient: n=5. The statistical significance values are denoted as: *p < .05, **p < .01 . Two tailed Student t test (a, b, c and g). Two-way ANOVA following Sidak’s multiple comparison test (e and f).
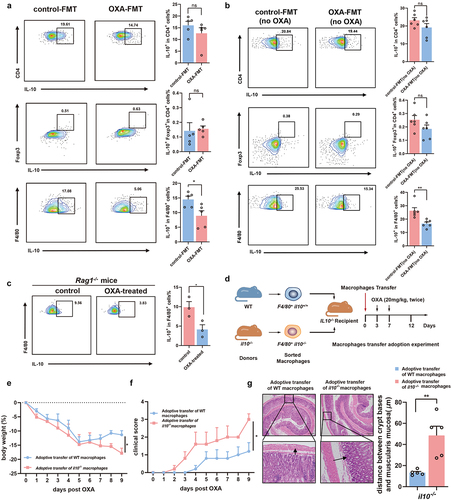
Figure 6. Restoration of microbiota-depleted probiotics alleviates chemotherapy-induced toxicity. (a) PCoA of the gut microbiota based on the permutational multivariate analysis of variance (PERMANOVA p = .046). (b) Differential analysis indicated the enrichment of bacteria in mice from oxaliplatin-treated group and control group. (c) Relative abundance of Lactobacillus (p = .0322) and Bifidobacterium(p < .0001) in mice from the control and oxaliplatin-treated group. (d) Relative abundance of Lactobacillus (p = .0553) and Bifidobacterium (p = .0386) in the control-FMT and OXA-FMT mice by qPCR detection. (e) Experimental design of SPF C57BL/6 mice with probiotics supplement, followed by oxaliplatin treatment. (f-h) Changes of body weight (p = .0220) (f), clinical score (p < .0001) (g), and survival analysis (p = .0189) (h) after administration of oxaliplatin. (i) Histopathological images of spleens (Scale bars, 200 μm). (j) Femurs from mice with probiotics treatment were stained with H&E (Scale bars, 100 μm) and quantification for bone marrow cellularity (p = .0233). (k) Histopathological images of colon (Scale bars, 200 μm) and quantification for the gaps between crypt bases and muscularis mucosa (p < .0001). Arrows indicate gaps between crypt bases and muscularis mucosa. (l) In colon tissue, the immunohistochemical staining of F4/80 (p = .0366), and IL-10 (p = .0056) was analyzed from the perspective of histological grades (H score) (Scale bars, 200 μm). (m) In spleen tissue, the immunohistochemical staining of F4/80 (p = .0471), and IL-10 (p = .0245) was analyzed from the perspective of histological grades (H score) (Scale bars, 200 μm). (n) In femur tissue, the immunohistochemical staining of F4/80 (p = .0272), and IL-10 (p = .0117) was analyzed from the perspective of histological grades (H score) (Scale bars, 100 μm). Each dot indicates an individual mouse. For a and b, baseline: n=20, control Day15: n=5, OXA-treated Day15: n=15. For f-h, control: n=7, probiotics: n=11. The statistical significance values are denoted as: *p < .05, **p < .01, ****p < .0001. Two-way ANOVA following Sidak’s multiple comparison test (f and g); two tailed student t test test (c, d, j, k, and l-n); log-rank test (h).
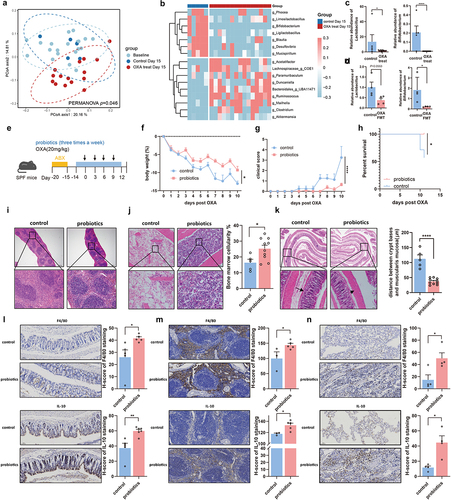
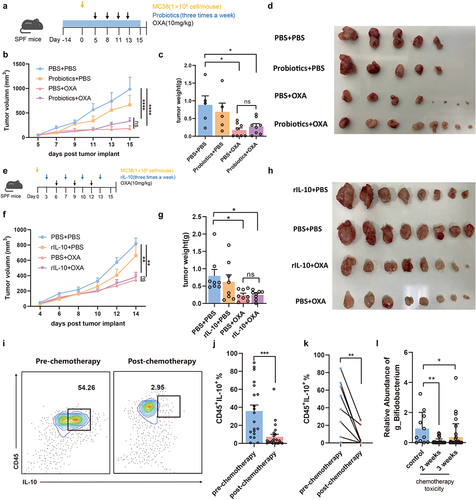
Figure 7. Improvement of toxicity does not influence the efficacy of chemotherapy. (a) Experimental design of supplement probiotics or PBS to SPF C57BL/6 mice with injection of MC38 cells, followed by oxaliplatin intervention. (b,c) Changes of tumor sizes (PBS+PBS vs. PBS+OXA: p < .0001, PBS+PBS vs. Probiotics+OXA: p < .0001, PBS+OXA vs. Probiotics+OXA: p = .3943) and tumor weights (PBS+PBS vs. PBS+OXA: p = .0160, PBS+PBS vs. Probiotics+OXA: p = .0464, PBS+OXA vs. Probiotics+OXA: p = .9439) in mice treated with probiotics or PBS. (d) Representative image of subcutaneous tumors from mice with treatment of probiotics or PBS. (e) Experimental design of supplement rIL-10 or PBS to SPF C57BL/6 mice with injection of MC38 cells, followed by oxaliplatin intervention. (f,g) Changes of tumor sizes (PBS+PBS vs. PBS+OXA: p = .0030, PBS+PBS vs. rIL-10+OXA: p = .0042, PBS+OXA vs. rIL-10+OXA: p = .9790) and tumor weights (PBS+PBS vs. PBS+OXA: p = .0452, PBS+PBS vs. rIL-10+OXA: p = .0491, PBS+OXA vs. rIL-10+OXA: p > .9999) in mice treated with rIL-10 or PBS. (h) Representative images of subcutaneous tumors from mice with treatment of rIL-10 or PBS. (i) Percentage of IL-10+CD45+ PBMCs from patients before and after chemotherapy detected by flow cytometry. (j) Changes of CD45+IL-10+ PBMCs from patients after chemotherapy treatment (p = .0001). (k) Changes of CD45+IL-10+ PBMCs from the same patient after chemotherapy treatment (p = .0067). (l)Relative abundance of the Bifidobacterium between the acute lymphoblastic leukemia children with intestinal toxicity and those sibling controls from a public microbiome dataset (control vs. 2 weeks: p = .0019, control vs. 3 weeks: p = .0431). Each dot indicates an individual. For j, pre-chemotherapy: n=20, post-chemotherapy: n=24. The statistical significance values are denoted as: *p < .05, **p < .01, ***p < .001, ****p < .0001. One-way ANOVA following Tukey’s multiple comparison test (c, g, and i); two-way ANOVA following Tukey’s multiple comparison test (b and f); two tailed student t test (j); paired Student t test (k).
Supplemental Material
Download Zip (16.3 MB)Data availability statement
The sequencing data used in our manuscript has been uploaded. The 16S rRNA gene sequence data are available at the NCBI by accession number PRJNA902737. The RNA-seq data files have been deposited in NCBI’s BioProject under accession number PRJNA903109. Public datasets are available at the NCBI by accession number PRJEB35526.