
Figures & data
Figure 1. Differentially expressed gene analysis in the colon of mice subjected to fecal microbiota transplantation (FMT) by receiving feces from healthy control (HC) and ulcerative colitis patients (UC). (a) Schematic diagram of the animal study. Each HC-FMT (n = 18) and UC-FMT (n = 12) mouse was orally transplanted once a day for 5 days. NC, normal control (n = 6), was orally administered with sterile saline instead of feces. (b-d) effects of FMT on the anxiety/depression-like behaviors in elevated plus maze task (EPM) (b), tail suspension task (TST) (c), and forced swim task (FST) (d). (e and f) RNA-seq analysis on mRNA isolated from the colon of mice subjected to FMT (HC-FMT; n = 6 and UC-FMT; n = 6). (e) Heatmap showing the results of supervised clustering between HC-FMT and UC-FMT group (fold change ≥ 1.5 and p-value <0.05; 258 genes). (f) Gene ontology enrichment analysis of 125 down-regulated genes among 258 DEGs. Statistical significance was calculated using a two-way ANOVA with post-hoc Tukey’s multiple comparisons tests (*p < 0.05; **p < 0.01; ***p < 0.001; ****p < 0.0001).
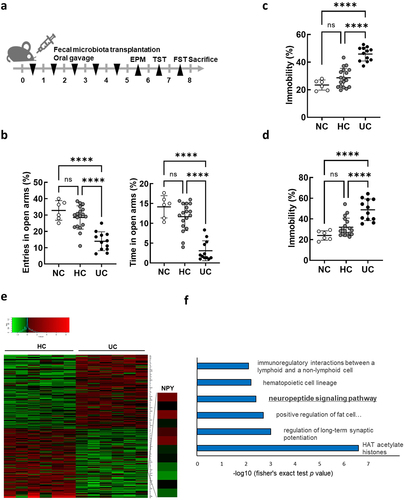
Figure 2. NPY expression in the colon and plasma of mice subjected to FMT by receiving feces from healthy control and UC patients. (a) mRNA expression of NPY family genes (NPY, PPY, and PYY) and their receptors (NPY1R, NPY2R, PPYR1, and NPY5R) in the colon of mice subjected to FMT by receiving feces from healthy control (HC-FMT; n = 6) and UC patients (UC-FMT; n = 6). (b) Representative bands and graphs showing western blot analysis of NPY protein in the colon of HC-FMT and UC-FMT mice. (c) Plasma levels of NPY in NC, HC-FMT, and UC-FMT mice measured by an enzyme-linked immunoassay kit. (d and e) colon and brain tissues were collected from control mice that were not subjected to FMT challenge. The mRNA (d) and protein (e) expression levels of NPY and its receptor NPY1R were evaluated in the colon and brain of the mice. Statistical significance between two groups was calculated using two-tailed unpaired t-test (*p < 0.05).
Figure 3. Association of enterococcus in the feces with anxiety and depression in UC patients. (a-g) gut microbiota composition of UC patients was analyzed using the datasets (HC; n = 6 and UC; n = 9) from our previous study.Citation10 OTU richness (a), principal coordinate analysis (PCoA) plot based on Jensen-Shannon analysis (b), phylum level (c), and linear discriminant analysis (LDA) (d) between HC and UC. (e) Spearman correlation analysis between HADS-A/D and gut microbiota composition family levels. (f and g) fecal bacteria relative abundance between the UC patients (n = 9) and healthy control (n = 6). (f) Number of colony forming unit (CFU) in DHL agar and mEnterococcus agar plates. (g) Fecal escherichia spp., Klebsiella spp., and Enterococcus spp. Populations. (h and i) fecal bacteria relative abundance between UC-F (n = 2) and HC-F (n = 6) used for FMT in figure 1. (h) Number of CFU in DHL agar and mEnterococcus selective agar plates. (i). Fecal escherichia spp., Klebsiella spp., and enterococcus spp. populations measured by qPCR. Statistical significance between two groups was calculated using two-tailed unpaired t-test (*p < 0.05; **p < 0.01; *** p < 0.001; **** p < 0.0001).
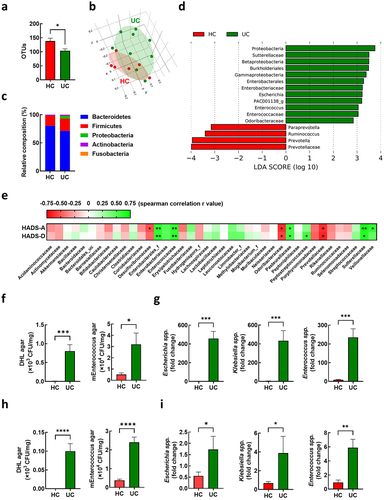
Figure 4. Effect of oral administration with Enterococcus mundtii (EM) on the levels of NPY in the colon, plasma, and hippocampus of mice. (a) Schematic diagram of the animal study. Bacteria isolated from UC patients (n = 8) was orally administrated once a day for 5 days. (b) mRNA expression of NPY in the colon of mice measured by RT-PCR. (c) Representative bands and graphs showing western blot analysis of NPY protein in the colon of mice (d) plasma levels of NPY in mice measured by an enzyme-linked immunoassay kit. (e) Representative bands and graphs showing western blot analysis of NPY protein in the hippocampus of mice (f) Representative images and graphs showing immunofluorescent analysis of NPY protein in the CA1,CA3, dentate gyrus (DG) region of the hippocampus of mice (n = 6). Scale bar = 500 μm/50 μm. Statistical significance between two groups was calculated using two-tailed unpaired t-test (*p < 0.05).
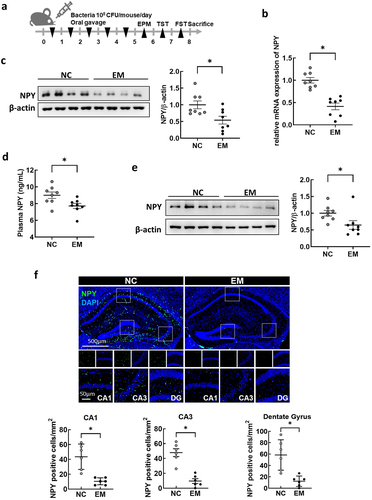
Figure 5. Effects of NPY intraperitoneal injection on the anxiety/depression-like behavior induced by E. mundtii. (a) Schematic diagram of the animal study. EM was orally administered (n = 4) once a day for 5 days, followed by NPY intraperitoneal injection once a day for 3 days. The anxiety/depression-like behaviors were evaluated using elevated plus maze task (EPM) (b), tail suspension task (TST) (c), and forced swim task (FST) (d). NPY 10 = 10 μg/kg; NPY 100 = 100 μg/kg. Statistical significance was calculated using a two-way ANOVA with post-hoc Tukey’s multiple comparisons tests (*p < 0.05; **p < 0.01; ***p < 0.001; ****p < 0.0001).
Figure 6. Effect of capsular polysaccharide (CP) of EM on the levels of NPY in mice and enteric endocrine cells. (a) Schematic diagram of the animal study. Capsular polysaccharide (CP) of EM (NK1516-CP or ATCC882-CP) (n = 6) or normal control (NC; sterile saline) (n = 6) was orally administrated once a day for 5 days. (b) Representative bands and graphs showing western blot analysis of NPY protein in the colon of mice orally administered with NK1516-CP. (c) Plasma levels of NPY in mice orally administered with NK1516-CP measured by an enzyme-linked immunoassay kit. (d) Representative bands and graphs showing western blot analysis of NPY protein in the hippocampus of mice orally administered with NK1516-CP (e) Representative bands and graphs showing western blot analysis of NPY protein in the hippocampus of mice orally administered with ATCC882-CP or NK1516-CP. (f and g) enteric endocrine cells STC1 were treated with cytosol or CP fraction of EM (NK1516) for 24 h. (f) mRNA expression of NPY in STC cells measured by qRT-PCR. (g) Representative bands and graphs showing western blot analysis of NPY protein in STC cells. Statistical significance between two groups was calculated using two-tailed unpaired t-test (*p < 0.05).
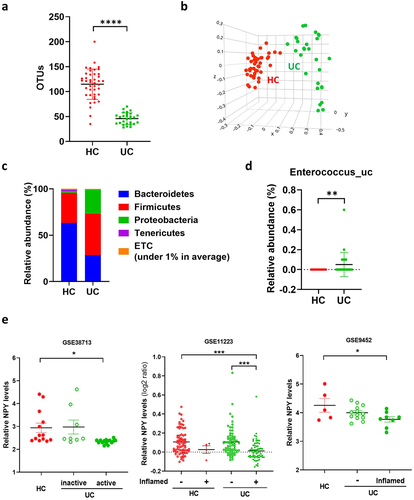
Figure 7. Enterococcus population and colonic NPY levels in UC patients. (a-d) gut microbiota composition of UC patients (N = 28) and healthy control (N = 42). Gut microbiota composition of UC patients was analyzed using datasets from the human microbiome project (http://portal.Hmpdacc.org). OTU richness (a), principal coordinate analysis (PCoA) plot based on Jensen-Shannon analysis (b), phylum level (c), and relative abundance of enterococcus_uc (unclassified) between UC and HC gut microbiota (d). Statistical significance between two groups was calculated using two-tailed unpaired t-test. (e) NPY expression in the colon of UC patients. NPY expression was evaluated using three GEO datasets (GSE38713, GSE9452, and GSE11223) in which colonic biopsy samples from healthy controls and UC patients were used. Statistical significance was calculated using a two-way ANOVA with post-hoc Tukey’s multiple comparisons tests. (*p < 0.05; **p < 0.01; ***p < 0.001; ****p < 0.0001).
Supplementary Information _Jan18_2024 clean.docx
Download MS Word (314.4 KB)Data availability statement
The sequencing data that support the findings of the study have been deposited in Dataon (https://dataon.kisti.re.kr) with identifier (doi: 10.22711/idr/974)