
Figures & data
Figure 1. The synergistic effects of anti-diabetic medicines and probiotics strain B. longum NBM7–1 (CKD1) on T2D-associated phenotypes in DB group. validation for synergistic effects of anti-diabetic medicines such as Lobeglitazone®, Sitagliptin®, and Metformin® with probiotics strain CKD1 on T2DM-associated with metabolic disorder in DB group. (a) body weights of positive control groups and (b) body weights of combined treatment groups. Mice were recorded every week for 8 weeks (n = 6). (c) the weights of epididymal white adipose tissue (eWAT), peripheral white adipose tissues (pWAT), subcutaneous white adipose tissues (sWAT), and total white adipose tissues (tWats). (d) Heatmap summarizing the results of plasma metabolic: FBG; fasting blood glucose, PBG; plasma blood glucose, INS; plasma insulin, HbA1c; glycated hemoglobin, HOMA-IR; Homeostatic model assessment of insulin resistance, C-peptide; plasma C-peptide, GLP-1; glucagon-like peptide 1, TG; plasma triglycerides, and TG; plasma TC in WT group compared to DB group. (e) Heatmap summarizing the results in administered treatments of anti-diabetic medicines or probiotics alone and combined treatments. HOMA-IR [(fasting blood glucose (mmol/L) × fasting insulin (mIU/L)/22.5)] was tested after 12 h fasting at week 8 (n = 6). The parameter values were relatively calculated with DB group. Red color: increase in values (index), blue color: decrease in values (index). Statistical significance is indicated as follows: *p < 0.05, **p < 0.01, and ***p < 0.001 WT vs DB group and #P < 0.05, ##P < 0.01, and ###P < 0.001 DB vs DB-treated with anti-diabetic medicines and CKD1 group by t-test by using PASW statistics 18 software® (IBM Co., Hong Kong).
![Figure 1. The synergistic effects of anti-diabetic medicines and probiotics strain B. longum NBM7–1 (CKD1) on T2D-associated phenotypes in DB group. validation for synergistic effects of anti-diabetic medicines such as Lobeglitazone®, Sitagliptin®, and Metformin® with probiotics strain CKD1 on T2DM-associated with metabolic disorder in DB group. (a) body weights of positive control groups and (b) body weights of combined treatment groups. Mice were recorded every week for 8 weeks (n = 6). (c) the weights of epididymal white adipose tissue (eWAT), peripheral white adipose tissues (pWAT), subcutaneous white adipose tissues (sWAT), and total white adipose tissues (tWats). (d) Heatmap summarizing the results of plasma metabolic: FBG; fasting blood glucose, PBG; plasma blood glucose, INS; plasma insulin, HbA1c; glycated hemoglobin, HOMA-IR; Homeostatic model assessment of insulin resistance, C-peptide; plasma C-peptide, GLP-1; glucagon-like peptide 1, TG; plasma triglycerides, and TG; plasma TC in WT group compared to DB group. (e) Heatmap summarizing the results in administered treatments of anti-diabetic medicines or probiotics alone and combined treatments. HOMA-IR [(fasting blood glucose (mmol/L) × fasting insulin (mIU/L)/22.5)] was tested after 12 h fasting at week 8 (n = 6). The parameter values were relatively calculated with DB group. Red color: increase in values (index), blue color: decrease in values (index). Statistical significance is indicated as follows: *p < 0.05, **p < 0.01, and ***p < 0.001 WT vs DB group and #P < 0.05, ##P < 0.01, and ###P < 0.001 DB vs DB-treated with anti-diabetic medicines and CKD1 group by t-test by using PASW statistics 18 software® (IBM Co., Hong Kong).](/cms/asset/1e357cf5-30cb-46bf-8ba7-1f2d94e2ae20/kgmi_a_2319889_f0001_oc.jpg)
Figure 2. Protective effects of combined treatments on liver steatosis in DB group. the liver samples were collected as shown in Figure S1, which included samples from WT group, DB group, DB group treated with anti-diabetic medicines or probiotics strain alone, and DB group treated with combined treatments of anti-diabetic medicines and probiotics strain for 8 weeks. (a) Representative histological images of liver tissues in DB group and in DB group treated with anti-diabetic medicines or probiotics strain alone, as well as in DB group treated with combined treatments. The presence of T2D led to lipid deposition in the liver, which was assessed using H&E staining. Bar: 100 μM. (b) quantification of lipid accumulation in the liver of WT and DB group, and quantification of lipid accumulation in the liver of DB group and DB group treated with anti-diabetic medicines or probiotics strain alone or combined treatments, as shown in panel A. (c,d) liver injury in DB group, DB-fed anti-diabetic medicines groups, and DB-fed probiotics strain group or DB-fed combined treatments groups. The levels of glutamic-oxaloacetic transaminase (GOT) and glutamic-pyruvic transaminase (GPT) were measured after euthanasia at week 8. The results are presented as means ± SD, *p < .05, **p < .01, and ***p < .001 WT vs DB group and #P < 0.05, ##P < .01, and ###P < 0.001 DB vs DB-treated with anti- diabetic medicines and CKD1 group by t-test by using PASW statistics 18 software® (IBM Co., Hong Kong).
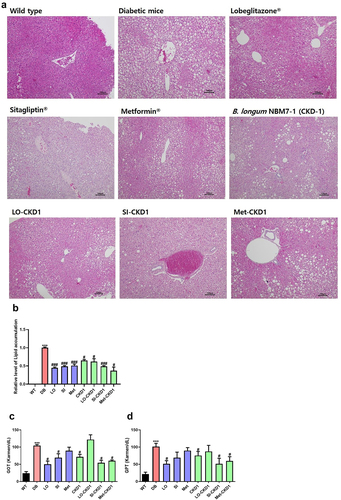
Figure 3. Effects of combined treatments on insulin signaling pathway, lipid metabolism, and inflammation-related gene expression in DB group. the liver samples were collected as shown in Figure S1, which were WT, DB, and DB treated with combined treatments for 8 weeks. (a) relative mRNA levels of genes related to hepatic insulin signaling, and (b) relative mRNA levels of genes related to hepatic gluconeogenesis, and (c) relative mRNA levels of genes related to hepatic adipogenesis, and (d) relative mRNA levels of genes related to hepatic oxidation, and (e) relative mRNA levels of genes related to hepatic inflammation in anti-diabetic drugs-fed DB, and CKD1-fed DB, or combined treatments-fed DB group. qPCR measurement of mRNA expression of insulin signaling genes of Irs2, Akt2, Ampk, G6p, and Pepck; adipogenesis genes of Pparγ, Srebpf1c, Acc, Lpl, Fas, Cd36, oxidation genes of Pgc1α, Cpt1, and Cpt2; inflammatory cytokine genes of il-6, and Tnf α; and in liver. The mRNA expression levels were relatively calculated with DB group. The results are presented as means ± SD, *p < .05, **p < .01, and ***p < .001 WT vs DB group and #P < .05, ##P < .01, and ###P < .001 DB vs DB-treated with anti- diabetic medicines and CKD1 group by t-test by using PASW statistics 18 software® (IBM Co., Hong Kong).
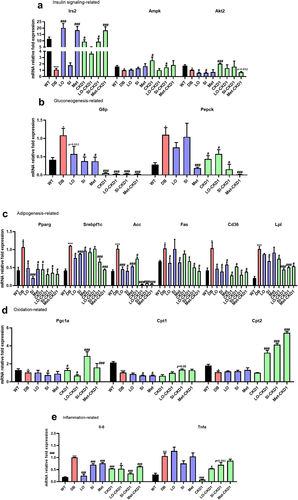
Figure 4. CKD1 enhanced the efficacy of the anti-diabetic medicines on T2DM-associated phenotypes in DB group. validation for CKD1 enhancement of the efficacy of the half maximal inhibitory concentration (IC50) of Lobeglitazone®, Sitagliptin®, and Metformin® on T2DM- associated with metabolic disorder. The experiment is described in Figure S3. (a) body weights of CKD1 treated group and (b–d) body weights of combined treatments of IC50 of anti-diabetic medicines and CKD1 groups. Mice were recorded every week for 8 weeks (n = 6). (e) the weights of epididymal white adipose tissue (eWAT), peripheral white adipose tissues (pWAT), subcutaneous white adipose tissues (sWAT), and total white adipose tissues (tWats) changes from IC50 of anti-diabetic medicines and CKD1 groups. (f–n) T2DM associated plasma metabolic parameters; FBG; fasting blood glucose, PBG; plasma blood glucose, INS; plasma insulin, HOMA-IR; Homeostatic model assessment of insulin resistance, HbA1c; glycosylated hemoglobin, C-peptide; plasma C- peptide, GLP-1; glucagon-like peptide 1, TG; plasma triglycerides, and TG; plasma TC, interleukin-1-beta; IL-1β, tumor necrosis factor- alpha; TNF-α, and interferon gamma; IFNγ in administered treatments IC50 of anti-diabetic medicines and CKD1 groups compared to DB group. HOMA-IR [(fasting blood glucose (mmol/L) × fasting insulin (mIU/L)/22.5)] was tested after 12 h fasting at week 8 (n = 6). Statistical significance is indicated as follows: *p < .05, **p < 0.01, and ***p < .001 WT vs DB group and #P < .05, ##P < .01, and ###P < .001 DB vs DB-treated with anti-diabetic medicines and CKD1 group by t-test by using PASW statistics 18 software® (IBM Co., Hong Kong).
![Figure 4. CKD1 enhanced the efficacy of the anti-diabetic medicines on T2DM-associated phenotypes in DB group. validation for CKD1 enhancement of the efficacy of the half maximal inhibitory concentration (IC50) of Lobeglitazone®, Sitagliptin®, and Metformin® on T2DM- associated with metabolic disorder. The experiment is described in Figure S3. (a) body weights of CKD1 treated group and (b–d) body weights of combined treatments of IC50 of anti-diabetic medicines and CKD1 groups. Mice were recorded every week for 8 weeks (n = 6). (e) the weights of epididymal white adipose tissue (eWAT), peripheral white adipose tissues (pWAT), subcutaneous white adipose tissues (sWAT), and total white adipose tissues (tWats) changes from IC50 of anti-diabetic medicines and CKD1 groups. (f–n) T2DM associated plasma metabolic parameters; FBG; fasting blood glucose, PBG; plasma blood glucose, INS; plasma insulin, HOMA-IR; Homeostatic model assessment of insulin resistance, HbA1c; glycosylated hemoglobin, C-peptide; plasma C- peptide, GLP-1; glucagon-like peptide 1, TG; plasma triglycerides, and TG; plasma TC, interleukin-1-beta; IL-1β, tumor necrosis factor- alpha; TNF-α, and interferon gamma; IFNγ in administered treatments IC50 of anti-diabetic medicines and CKD1 groups compared to DB group. HOMA-IR [(fasting blood glucose (mmol/L) × fasting insulin (mIU/L)/22.5)] was tested after 12 h fasting at week 8 (n = 6). Statistical significance is indicated as follows: *p < .05, **p < 0.01, and ***p < .001 WT vs DB group and #P < .05, ##P < .01, and ###P < .001 DB vs DB-treated with anti-diabetic medicines and CKD1 group by t-test by using PASW statistics 18 software® (IBM Co., Hong Kong).](/cms/asset/9738e53c-3d40-4338-b9ca-ce966bc2f822/kgmi_a_2319889_f0004a_oc.jpg)
Figure 4. (Continue).
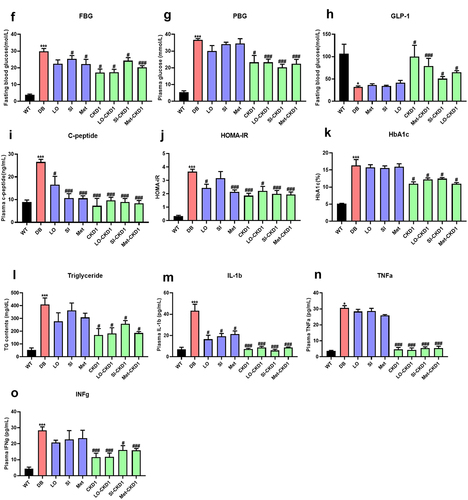
Figure 5. CKD1 prevented the hepatic lipid accumulation in DB-fed IC50 of anti-diabetic medicines groups. validation for CKD1 protect effects liver steatosis in DB-fed IC50 of anti-diabetic medicines groups. The experiment is described in Figure S3., which included samples from WT group, diabetic DB group, DB-fed IC50 of anti-diabetic medicines or CKD1 alone, and DB-fed combination of IC50 of anti-diabetic medicines and probiotics strain for 8 weeks. (a) representative histological images of liver tissues in DB group and in DB-fed IC50 of anti- diabetic medicines or probiotics strain alone, as well as in DB-fed combination treatments groups. (b) quantification of lipid accumulation in the liver of as shown in panel A by using ImageJ software. The presence of T2D led to lipid deposition in the liver, which was assessed using H&E staining. Bar: 100 μM. (c) the levels of glutamic-oxaloacetic transaminase (GOT), (d) the levels of glutamic-pyruvic transaminase (GPT), indicating liver injury in DB, DB-fed CKD1, and DB-fed IC50 of anti-diabetic medicines groups. The results are presented as means ± SD, *p < .05, **p < .01, and ***p < .001 WT vs DB group and #P < .05, ##P < .01, and ###P < 0.001 DB vs DB-treated with anti- diabetic medicines and CKD1 group by t-test by using PASW statistics 18 software® (IBM Co., Hong Kong).
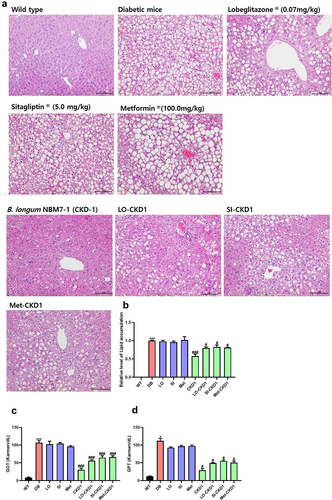
Figure 6. CKD1 changed the mRNA expression levels related to metabolism, inflammation, tight junction, and IL-22 signaling in the liver, ileum, and pancreas the efficacy of anti-diabetic medicines on the T2DM-associated phenotypes in DB group. validation for CKD1 effects gene expression in DB- fed IC50 of anti-diabetic medicines group. The experiment is described in Fig. S3. (a) relative mRNA levels of genes related to hepatic insulin signaling, and (b) relative mRNA levels of genes related to hepatic gluconeogenesis, and (c) relative mRNA levels of genes related to hepatic adipogenesis, and (d) relative mRNA levels of genes related to hepatic oxidation, and (e) relative mRNA levels of genes related to hepatic inflammation, and (F) relative mRNA levels of gene related to hepatic IL-22 signaling, (G) relative mRNA levels of genes related to ileum IL-22 signaling and tight junction protein, and (H) relative mRNA levels of gene related to pancreatic IL-22 signaling in WT group, DB-fed IC50 of anti-diabetic medicines group, DB-fed CKD1 group, or DB-fed combined treatments group relatively compared to DB group. qPCR measurement of mRNA expression of insulin signaling genes of Irs2, Ampk, Akt2, gluconeogenesis genes of G6p, and Pepck; adipogenesis genes of Pparγ, Srebpf1c, Acc, Fas, oxidation genes of Pparα, Pgc1α, Cpt1, and Cpt2; inflammatory cytokine genes of Il-β, Il-6, and Ifnγ; and IL-22 signaling genes of Il-22, Il-22ra, and Reg3γ; tight junction genes of zo-1, and Occ; pro-inflammatory cytokine genes of Il-1β, Infγ and Il-6. The parameter values were relatively calculated with DB group. Statistical significance is indicated as follows: *p < .05, **p < .01, and ***p < .001 WT vs DB group and #P < .05, ##P < .01, and ###P < .001 DB vs DB-treated with anti-diabetic medicines and CKD1 group by t-test by using PASW statistics 18 software® (IBM Co., Hong Kong).
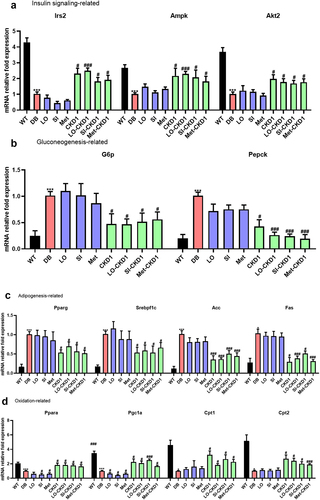
Figure 6. (Continue).
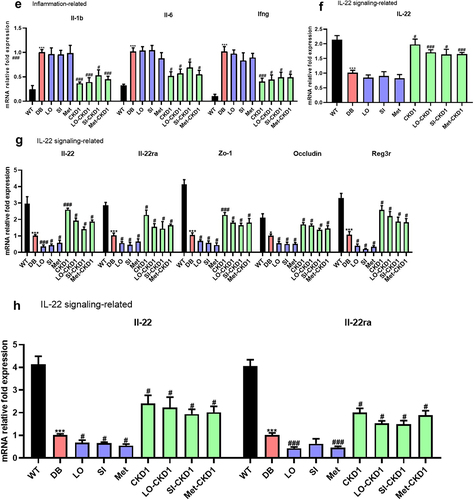
Figure 7. Synergistic effects of Metformin® and CKD1 on gut microbiota. after an 8-week intervention, total bacterial DNA was isolated from feces, the 16S rRNA gene was sequenced, and the SCFA concentration was measured using gas chromatography-mass spectrometry (GC- MS). (a–d) LEfSe analysis with significant differences in abundance between WT group, DB group, DB-fed IC50 of Metformin®, DB-fed CKD1, and DB-fed combination of IC50 of Metformin® and CKD1 groups. (e–g) correlating the gut microbiota T2DM-associated metabolic parameters in WT group, DB group, DB-fed CKD1, and DB-fed combination of IC50 of Metformin® and CKD1 groups (n = 6 animals per groups). Statistical significance is indicated as follows: *p < .05, **p < .01, and ***p < .001 WT vs DB group and #P < 0.05, ##P < .01, and ###P < .001 DB vs DB-treated with anti-diabetic medicines and CKD1 group by t-test by using PASW statistics 18 software® (IBM Co., Hong Kong).
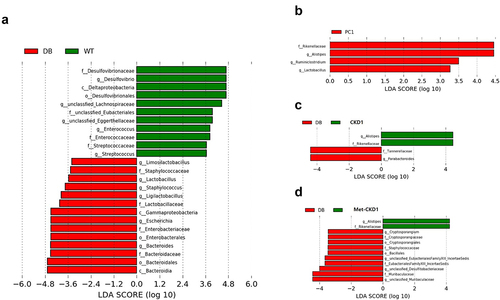
Figure 7. (Continue).
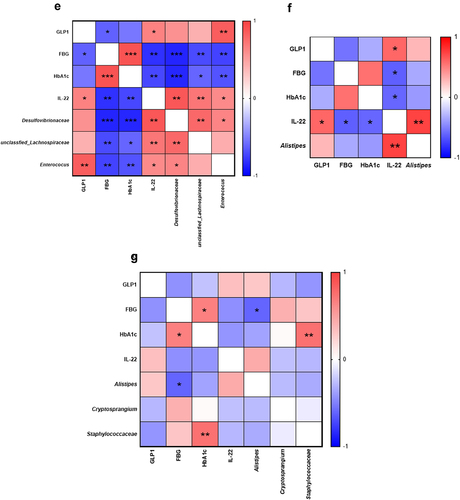
Figure 8. Synergistic effects of MetforminⓇ and CKD1 on fecal SCFAs and Gpr43/109a in ileum of DB group. After an 8-week intervention, the SCFA concentration was measured using gas chromatography-mass spectrometry (GC-MS). (a–c) fecal concentrations of SCFAs after an 8-week intervention (n = 3 animals per groups). (d,e) Gpr43/109a expression on ileum in T2DM mouse measured by qRT-PCR (n = 6). Statistical significance is indicated as follows: *p < .05, **p < .01, and ***p < .001 WT vs DB group and #P < .05, ##P < .01, and ###P < .001 DB vs DB-treated with anti-diabetic medicines and CKD1 group by t-test by using PASW statistics 18 softwareⓇ (IBM Co., Hong Kong).
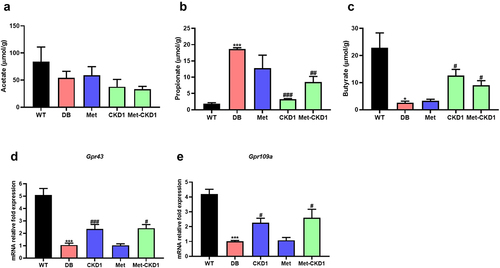
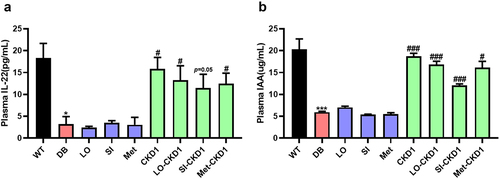
Figure 9. CKD1 enhanced the IL-22 signaling through the elevated plasma IAA and IL-22. after an 8-week experimental period, the blood samples were collected as shown in Figure S3, which were WT, DB, and DB-fed IC50 of anti-diabetic medicines and probiotics strain alone or in combination for 8 weeks. (a) ELISA measurement of plasma IL-22. (b) ELISA measurement of plasma indole-3-acetic acids (IAA). n = 5 to 6 mice per group. Statistical significance is indicated as follows: *p < .05, **p < .01, and ***p < .001 WT vs DB group and #P < .05, ##P < 0.01, and ###P < .001 DB vs DB-treated with anti-diabetic medicines and CKD1 group by t-test by using PASW statistics 18 softwareⓇ (IBM Co., Hong Kong).
Supplemental Material
Download Zip (682.8 KB)Data availability statement
The 16s rRNA sequencing data for CKD1(SUB12927731) was registered in the NCBI sequence Read Archive (SRA) database.