Figures & data
Figure 1. Patients with right-sided colorectal cancer exhibit distinct bacterial profiles and showed poor survival in patients colonized by Colibactin. (a) Principal coordinate analysis (PCoA) with Bray-Curtis distances matrix between non-relapse and relapse right-sided CRC patients. (b) Box plot with the relative abundance of Escherichia coli. The significance p-value was calculated using the Wilcoxon rank sums test. (c) Kaplan-Meier analysis from patients colonized by Escherichia coli harboring the pks island at stage I-II. (d) Kaplan-Meier analysis from patients colonized by Escherichia coli harboring the pks island at stage III-IV. (e) and (f) volcano plots of differentially expressed metabolites between tumor tissue and tumor-adjacent stroma in two groups: relapse (24 tumors versus 21 tumors-adjacent stroma) and non-relapse (53 tumors versus 51 tumors-adjacent stroma), respectively. Dashed lines indicated the following significance threshold: 2.0 > log2 fold change < -2.0 and FDR-adjusted p-value <0.0005.
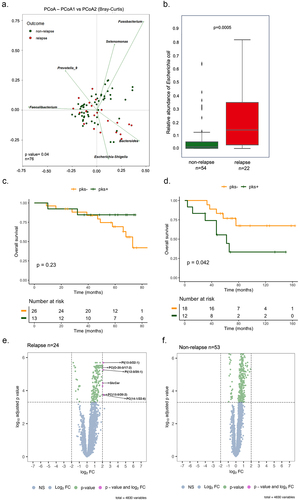
Figure 2. Right-sided colorectal cancer patients colonized by CoPEC with relapse reveal enrichment of genes associated with lipid metabolism and DNA double-strand break. (a) Volcano plots and venn diagram of differentially expressed genes in response to pks+ versus – pks− tumors from relapse (n = 17) and non-relapse groups (n = 30). Dashed lines indicated the following significance threshold: 1.0 > log2 fold change < -1.0 and p-value <0.05. (b) and (c) heatmap showing logFC of genes associated with cellular lipid metabolic process and double-strand break repair (FUMA-GO biological process) in response to pks+ versus -pks− tumors from relapse and non-relapse groups. (c) Schema showing genes involved in the biosynthesis of the lipid in both the Kennedy pathway (De novo synthesis) and lands cycle. Highlighted genes in response to pks+ versus -pks− tumors from the relapse group. Red: up-regulated and blue: down-regulated.
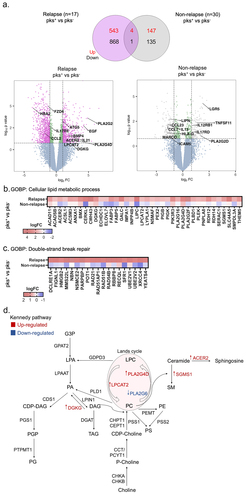
Figure 3. Spatial metabolomics revealed an increase in glycerophospholipid in tumor-associated bacterial microniches mainly in patients colonized by colibactin-producing Escherichia coli (CoPEC). (a) Representative images of MALDI-FTICR and overlap with FISH (bacteria stained with general rRNA probe EUB338 conjugated to Alexa 555 - orange) from pks+ and – pks− tumors. (b) and (c) volcano plot displaying metabolomic analysis from pks+ (ROI with bacteria versus ROI without bacteria) and pks− (ROI with bacteria versus ROI without bacteria) patients, respectively. Root means square normalization was applied, adjusted p. value (FDR correction) < 0.05, and log2FC >1 or < -1 were considered. (d) Heatmap showing differentially expressed lipids in the ROI with bacteria between pks+ and – pks− tumors. (e) Graphic showing the difference in metabolite expression in bacteria area (n = 12) and all tumor tissue (n = 65).
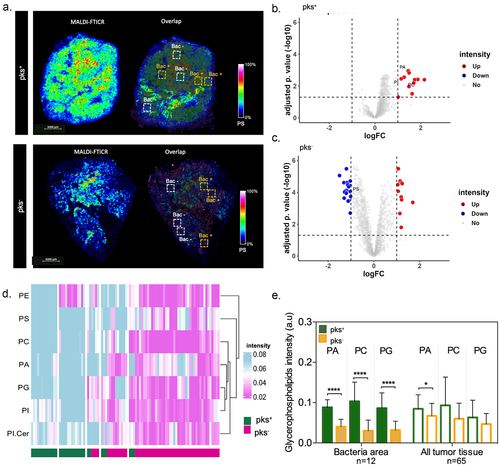
Figure 4. Bacterial colibactin leads to lipid droplet accumulation in human colon cancer cells. (a) Representative image of Nile red staining (×63 magnification, scale bar = 10 µm) using HCT116 cells. Nuclei (DAPI – blue), lipid droplet (red). (b) Lipid droplet quantification (300 cells) under different bacterial infections: CoPEC 11G5 strain, isogenic mutant 11G5ΔclbQ strain and negative control (NC, non-infected). (c) MC38 cells were infected with the 11G5 strain or the 111G5ΔclbQ and were analyzed 5 days post-infection. Lpcat2 mRNA levels from MC38 cells were quantified using qRT-PCR. (d) The built PCA-LDA classification model is based on three groups: HCT116 cells infected with CoPEC strain (11G5), a mutant strain that does not produce CoPEC (11G5∆clbQ) and non-infected (negative control). Representative m/z chromatograms. (e – h) graphs with the intensity of PC, LPC and PS differentially expressed under the conditions studied.
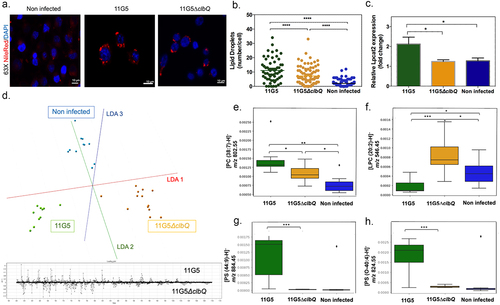
Figure 5. Chemoresistance in CRC cells is preceded by elevated levels of reactive oxygen species after CoPEC colonization. (a) Volcano plot representation of differentially expressed genes between MC38 infected with a mutant strain that does not produce CoPEC (11G5∆clbQ) and CoPEC strain (11G5). (b-d) representation of the enrichment of genes involved in both oxidative phosphorylation and adipogenesis. (e) Representative image of CellRox staining for intracellular reactive oxygen species in HCT116 infected with CoPEC strain (11G5), a mutant strain that does not produce CoPEC (11G5∆clbQ) and non-infected (negative control). Fluorescent images were captured after 4 h of treatment (3 h of infection +1 h pos-infection) under MOI 10. (f) A semi-quantitative assessment of the percentage of ROS in 300 cells was evaluated using different scores from 0 to 3 using MC38 and HCT116 cells. Data are expressed by the percentage of cells in each score and group (two independent experiments and duplicates for each experiment). * p < 0.05, ** p < 0.01, *** p < 0.001 and *** p < 0.0001. (G) MC38 cells were infected with CoPEC strain (11G5), a mutant strain that does not produce CoPEC (11G5∆clbQ) and non-infected supplemented with oxaliplatin (20 μg/mL). Non-infected cells without oxaliplatin were used to represent 100% viability. Values represent means ± SEM. (H) MC38 cells were infected with CoPEC strain (11G5) and 3-week post-infection cells were used supplemented with oxaliplatin (5 μg/mL) in the absence or presence of triacsin C (10 µM). 11G5-infected cells without oxaliplatin were used to represent 100% viability. Values represent means ± SEM. Cell viability was assessed using WST-1 assay reagent – cell proliferation assay.
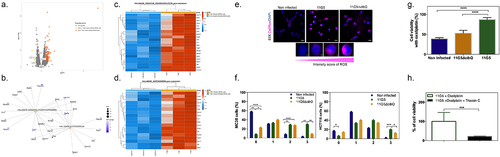
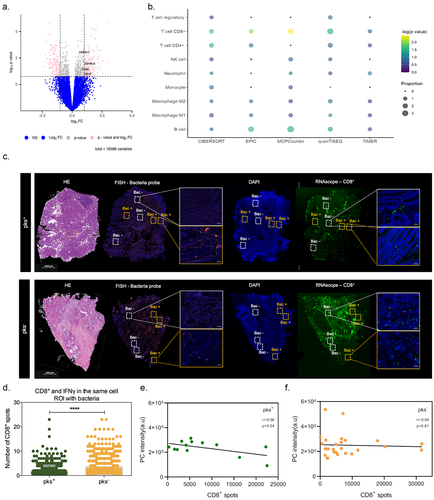
Figure 6. Bacterial microniches are poorly infiltrated with IFNγ-producing CD8+ T-cells in right-sided CRC patients colonized by CoPEC. (A) Volcano plot representation of differentially expressed genes between CoPEC-positive and -negative patients. Dashed lines indicated the following significance threshold: 1.0 > log2 fold change < -1.0 and p-value <0.05. (B) Bubble plot showing the proportional difference of immune cells between pks+ and – pks− patients based on the following computational methods: CIBERSORT, EPIC, MCP-counter, quanTiseq and TIMER. (C) Representative images of H&E, in situ hybridization (FISH – bacteria stained with general rRNA probe EUB338 conjugated to Alexa 555 - orange) and the nuclear DNA stained with DAPI (blue)), RNAscope (hs-CD8A (560391-C3, Opal 520 - green) from pks+ and – pks− tumors. White square: ROI without bacteria and orange square: ROI with bacteria. (D) Quantification of CD8+ T-cells and IFNγ in the same cells in the ROI with bacteria from pks+ and – pks− tumors. **** p < 0.0001. (E) and (F) Pearson correlation between CD8+ T-cell spots detected by the RNAscope and phosphatidylcholine (PC) identified by the MALDI-FTICR in pks+ and – pks− tumors, respectively.