
Figures & data
Figure 1. Weaning induces decreased gut barrier function and an increase of IgA-coated bacteria.
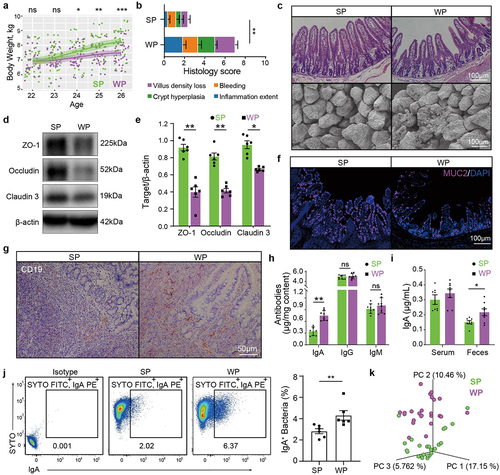
Figure 2. The bacteroides taxon is enriched upon weaning and associated with diarrhea when not highly coated with IgA.
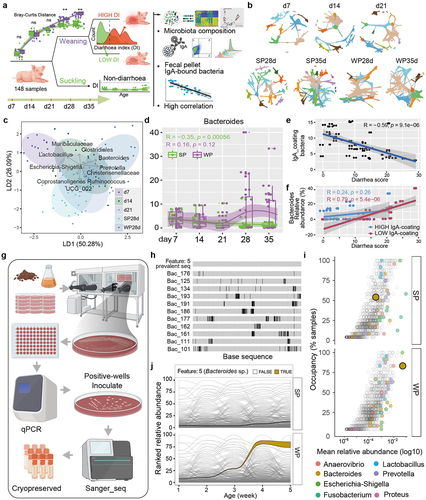
Figure 3. Weaning stress remodels epithelial and immune cells to emphasize IgA-producing CD138+ PCs.
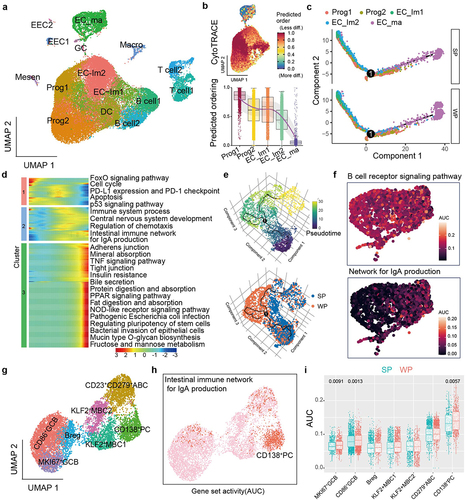
Figure 4. B. uniformis elicits IgA responses in CD138+ PCs and alleviates DSS-induced colitis.
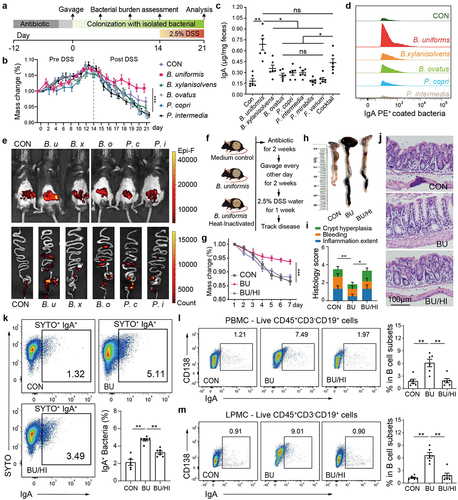
Figure 5. Low IgA responses in CD138+ PCs fail in entrapping B. uniformis and aggravate colitis.
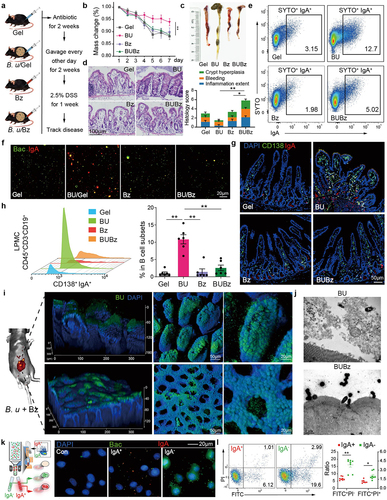
Figure 6. B. uniformis exacerbates colitis in the absence of IgA or CD138+ PCs.
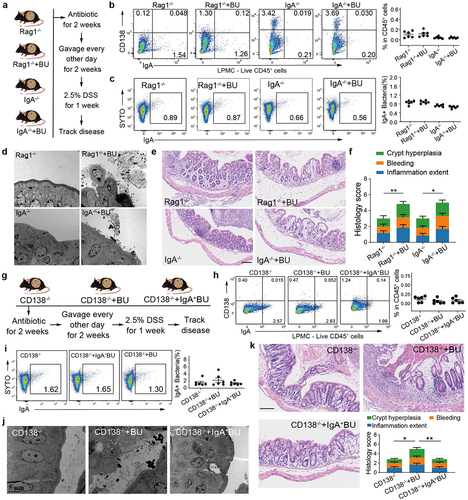
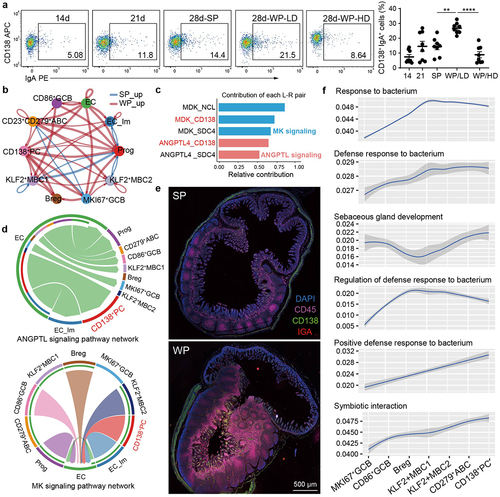
Figure 7. CD138+ PCs mediate interactions with enterocytes and bacterium in weaning stress.
Supplementary Materials.docx
Download MS Word (4.7 MB)Data availability statement
The raw sequencing data have been deposited in the National Center for Biotechnology Information (NCBI) Sequence Read Archive (SRA) repository with accession number PRJNA970096 and PRJNA974859. Source data are provided with this article. R markdown scripts enabling the analysis for data are uploaded at https://github.com/Tangwenjie34 and https://github.com/yusenWei. Specific codes are accessible from the authors. All database and detailed description of the methods are available in the main text or the supplementary materials.