
Figures & data
Figure 1. Alterations in body weight, and phenotype of hematopoietic damage in mice after 45 days of benzene exposure.
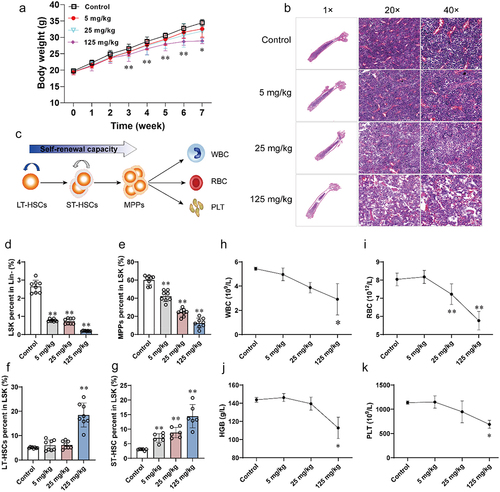
Figure 2. Absolute quantification of cytokines in plasma.
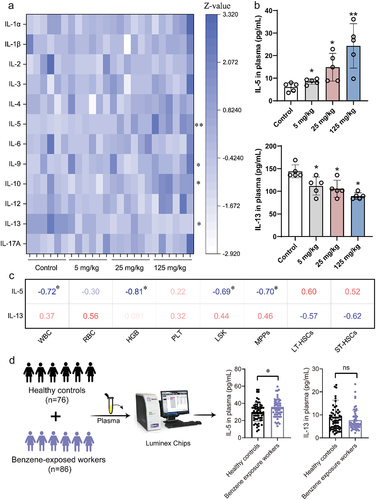
Figure 3. Altered gut microbiota composition in mice after benzene exposure.
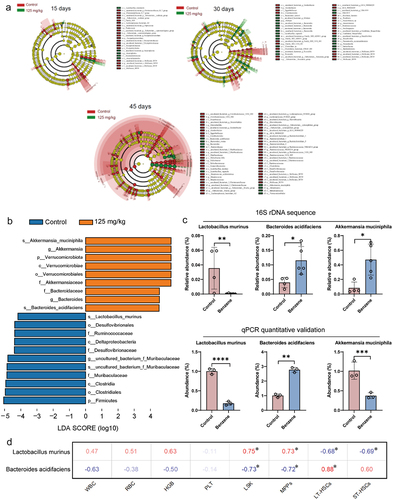
Figure 4. Altered plasma metabolite profiles in mice after 45 days of benzene exposure.
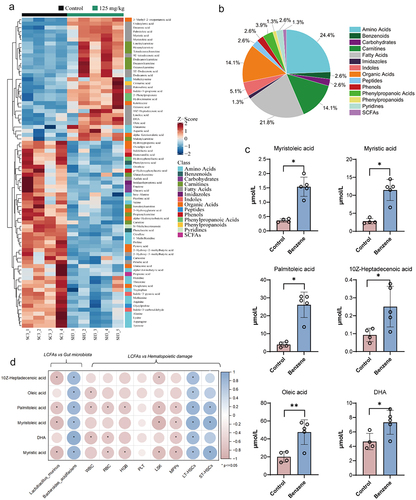
Figure 5. Gut microbiota contribute to benzene-induced hematopoietic damage by regulating fatty acid metabolism.
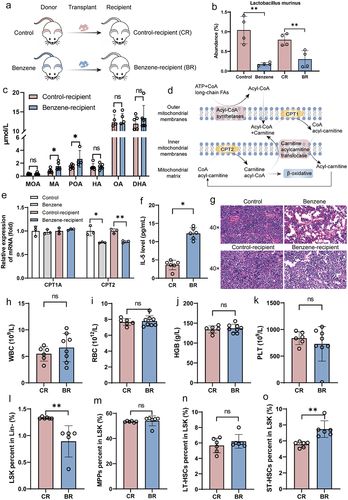
Figure 6. Elevated LCFAs promote benzene-induced hematopoietic toxicity.
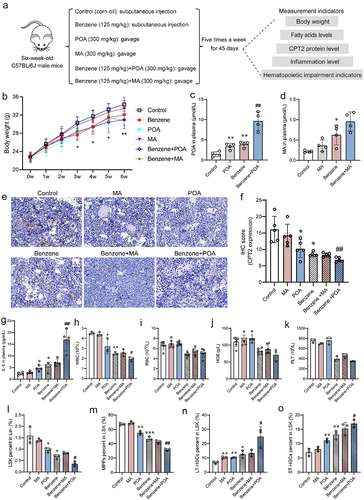
Figure 7. Effect of CPT2 overexpression on benzene-induced hematopoietic damage.
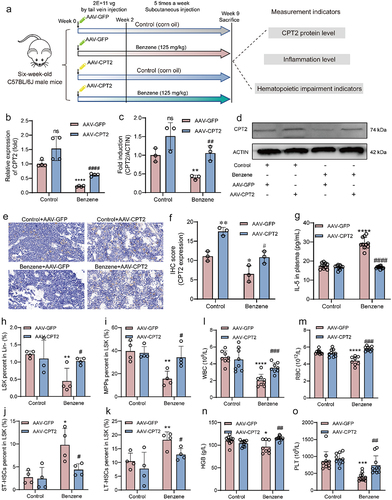
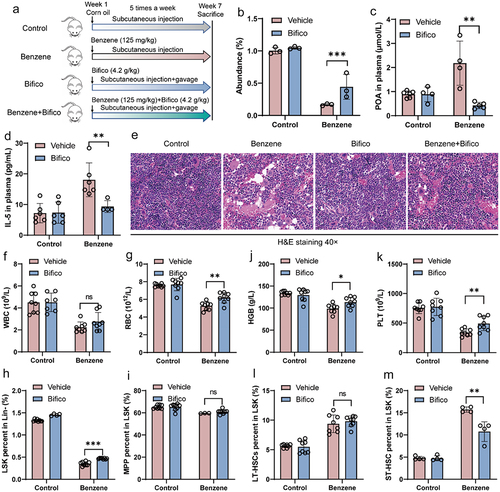
Figure 8. Probiotic supplementation protects the mice from benzene-induced hematopoietic damage.
Revised Supplementary Materials clean.docx
Download MS Word (1.1 MB)Data availability statement
The microbial raw data reported in this paper have been deposited in the China National Center for Bioinformation (https://ngdc.cncb.ac.cn) and the accession numbers are PRJNA1068769.